Schedule a Demo
Schedule a Demo
Read More
Content
Filter
10 results found
Featured
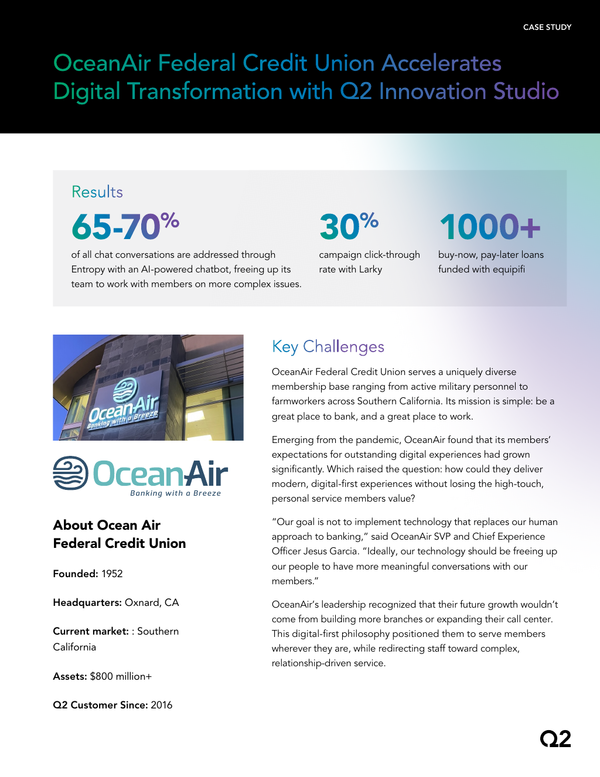
OceanAir Federal Credit Union Case Study
Featured
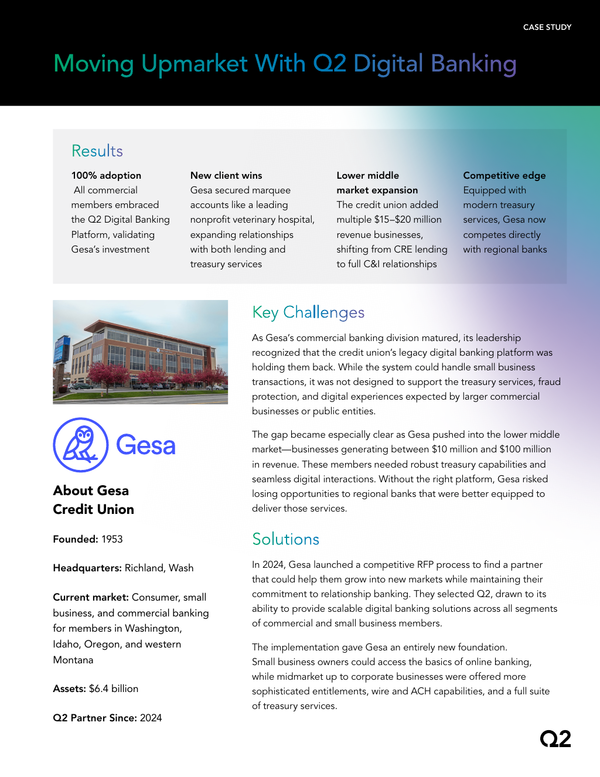
Gesa Credit Union Case Study
Featured
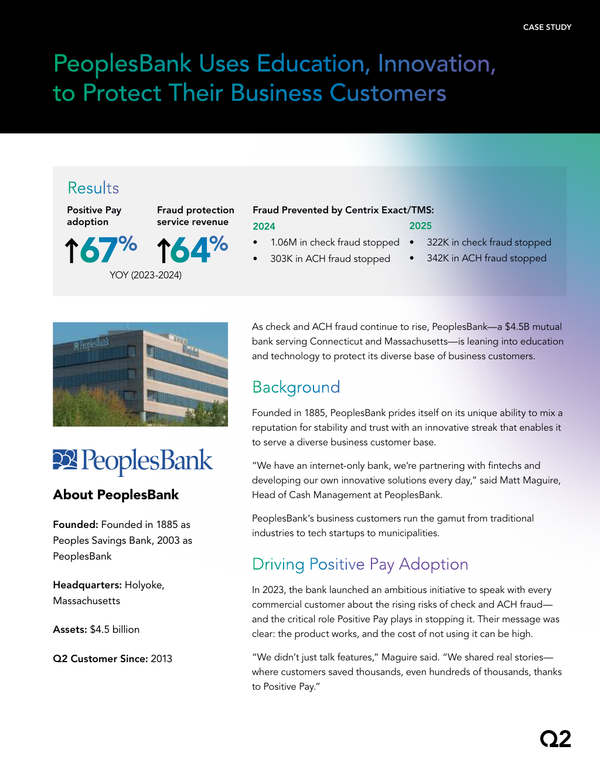
PeoplesBank Uses Education, Innovation to Protect Their Business Customers
Featured
Get the Latest News and Updates from Q2
Featured
Inside Gen Z: The Story Behind the Numbers
Featured
Fraud Intelligence: Build Trust. Not Friction (ebook)
Featured
Commercial Loan and Deposit Pricing Market Update: September 2025
Featured
Striking the Balance With Fraud Management
Featured
Lessons in Loyalty: A Live Q&A With Gen Z Consumers
Featured
Inside Gen Z: Lessons in Loyalty
Featured
Content types
None
Case Study
(1)
Blog
(3)
Podcast
(2)
White Paper
(1)
Webinar
(1)
Topics
None
Digital Banking
(6)
Fintech partnerships
(3)
Personalization
(3)
Fraud
(4)
Commercial Pricing
(1)
Money Movement
(1)
Segment
None
Consumer
(7)
Small Business
(5)
Commercial
(5)
Solutions
None
Digital Banking Platform
(5)
Personal Finance Management
(2)
Targeting and Marketing
(2)
Risk and Fraud
(3)
Relationship Pricing
(1)
Fintech Integration
(1)
Payments
(1)