Schedule a Demo
Schedule a Demo
Read More
Contents
Filters
10 results found
Featured
Serving Commercial Customers with International Payments
Featured
5 Digital Imperatives to Maximize Growth and Efficiency in a Recession
Featured
Three Approaches to Trending Consumer Banking Challenges
Featured
Building Better Banking With Q2 Innovation Studio: Real Stories of Real Transformation
Featured
Turn a “Dumb Commodity” into a Huge Opportunity
Featured
Are You Ready for the Imminent Disruption of Commercial Banking?
Featured
Evolving Your Digital Strategy
Featured
Navigating the Consumer Banking Landscape: A Field Guide
Featured
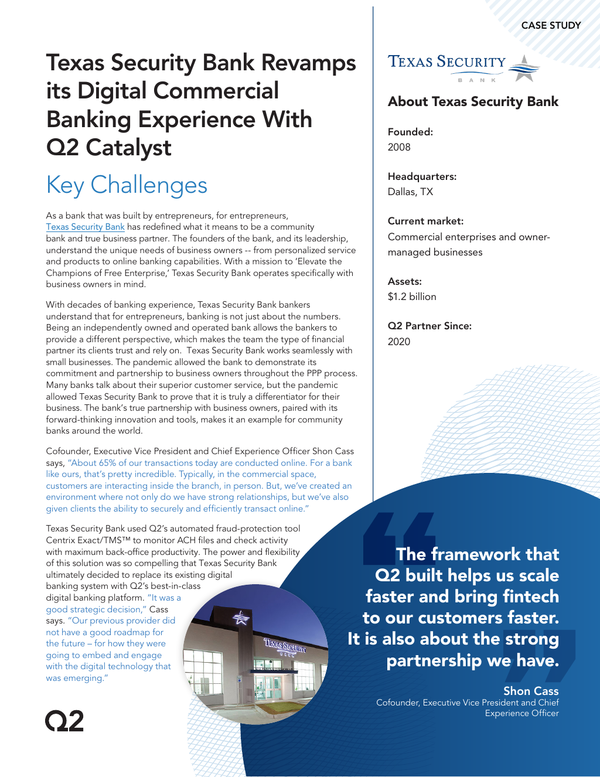
Texas Security Bank Revamps Its Commercial Banking with Q2 Catalyst
Featured
Javelin Small Business Digital Banking Vendor Scorecard Report
Featured
Content types
None
Blog
(7)
White Paper
(1)
Case Study
(1)
Market Analysis
(1)
Topics
None
Money Movement
(2)
Digital Banking
(4)
Fintech partnerships
(4)
Personalization
(3)
Positive Pay
(1)
Segment
None
Commercial
(4)
Consumer
(1)
Small Business
(2)
Solutions
None
Payments
(1)
Digital Banking Platform
(4)
Digital Onboarding
(1)
Fintech Integration
(2)
Targeting and Marketing
(1)
Risk and Fraud
(1)