Schedule a Demo
Schedule a Demo
Read More
Contents
Filters
10 results found
Featured
Leveraging the Power Trio of Serving Large Commercial Clients
Featured
2025 Retail Banking Trends and Priorities Report Credit Union Edition
Featured
Building Better Banking With Q2 Innovation Studio: Real Stories of Real Transformation
Featured
5 Digital Imperatives to Maximize Growth and Efficiency in a Recession
Featured
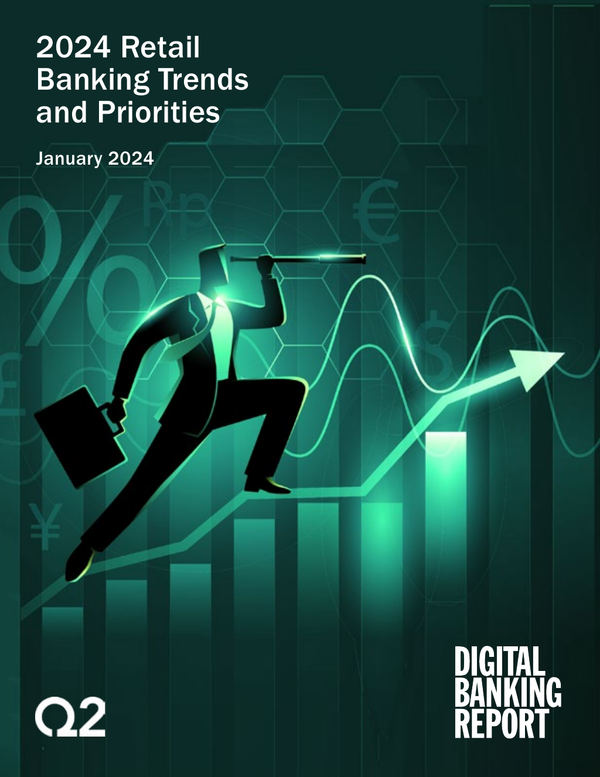
2024 Retail Banking Trends and Priorities Report
Featured
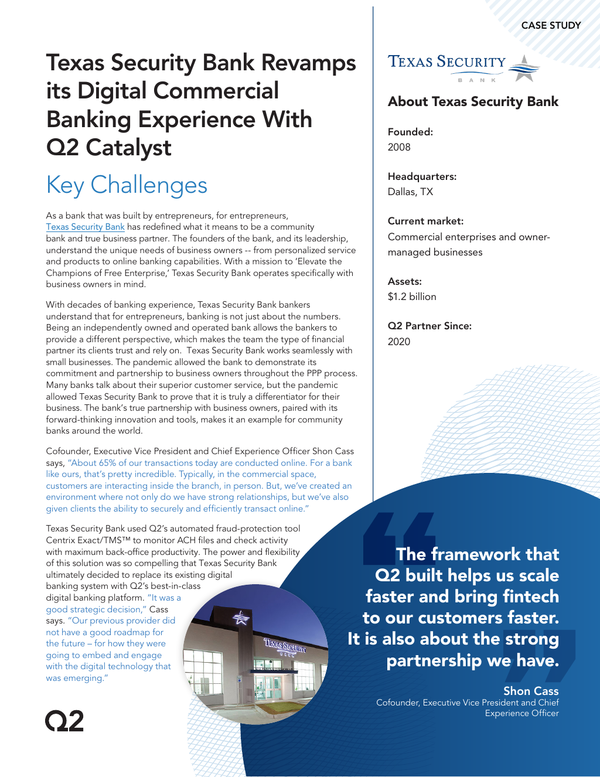
Texas Security Bank Revamps Its Commercial Banking with Q2 Catalyst
Featured
Three Approaches to Trending Consumer Banking Challenges
Featured
Small Business Tools, Tactics, and Transformation
Featured
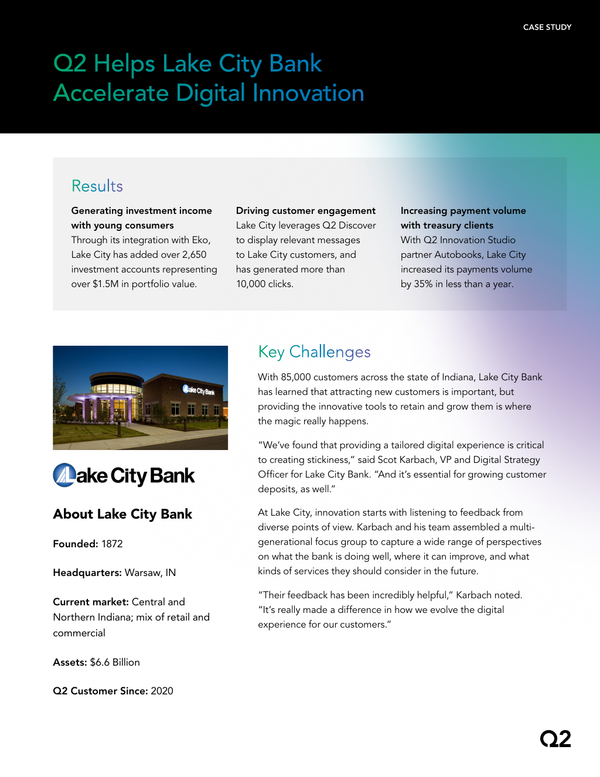
Lake City Bank Case Study
Featured
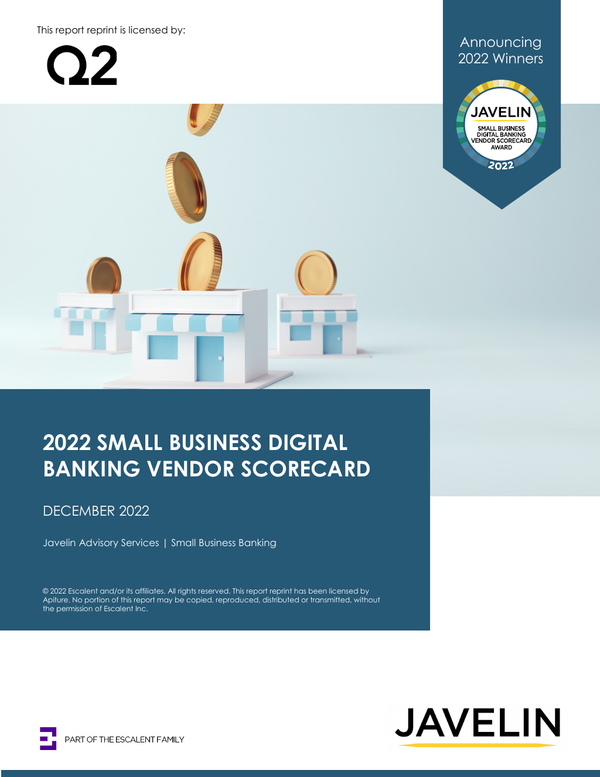
Javelin Small Business Digital Banking Vendor Scorecard Report
Featured
Content types
None
Blog
(5)
Market Analysis
(3)
Case Study
(1)
Topics
None
Digital Banking
(3)
Fintech partnerships
(3)
Personalization
(3)
Positive Pay
(1)
Segment
None
Consumer
(3)
Commercial
(2)
Small Business
(2)
Solutions
None
Digital Banking Platform
(4)
Digital Onboarding
(1)
Fintech Integration
(2)
Risk and Fraud
(1)
Targeting and Marketing
(1)