Commercial Loan and Deposit Pricing Market Update: June 2024
Reminder: This market update is based on the previous month’s (May 2024) data in the Q2 PrecisionLender database.
In this month’s update, we continued our examination of reported deal selectivity among financial institutions, comparing the cohort of opportunities priced to the deals that have made it through the pipeline and are ready to close.
We also took a closer look at interest rate floor activity, as an indication of margin protection. now that there's an expectation that rates will be held "higher for longer” before the anticipated rate decreases later in 2024/2025.
Finally, we continued to track the rates being paid for deposits.
Read on to get the full story, and updates on other key market metrics.
Note for those new to these updates: PrecisionLender uses an assumed marginal duration matched funding cost, not the bank’s actual average cost of funds, when referring to the Cost of Funds (COF) on loan pricing activity.
Volume expansion continues
The initial takeaway for market activity during May was: “More of the same.”
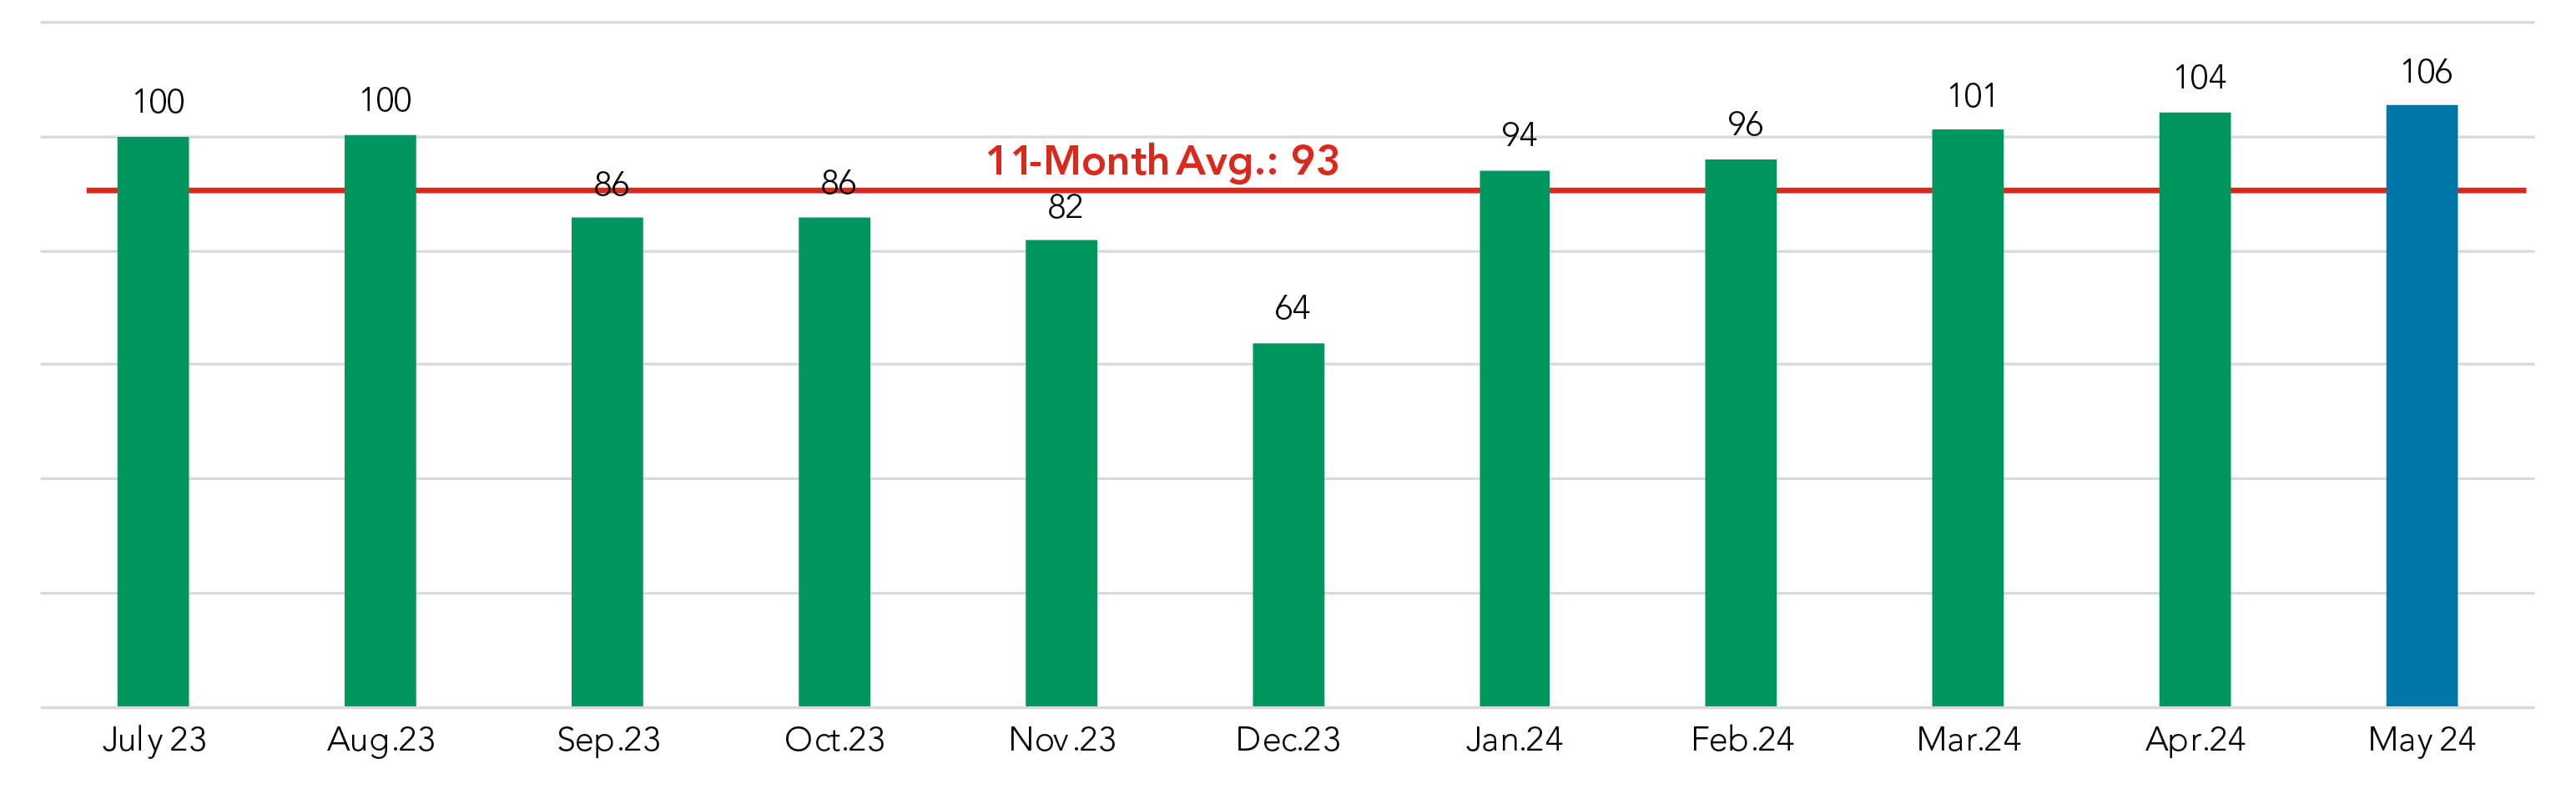
Pricing volume continued to steadily expand, as it has throughout 2024 so far. The past three months have each posted higher levels than July/August 2023.
Priced Commercial Volume in S
(Indexed to July 2023 = 100)
So far in 2024, no breakouts for spreads …
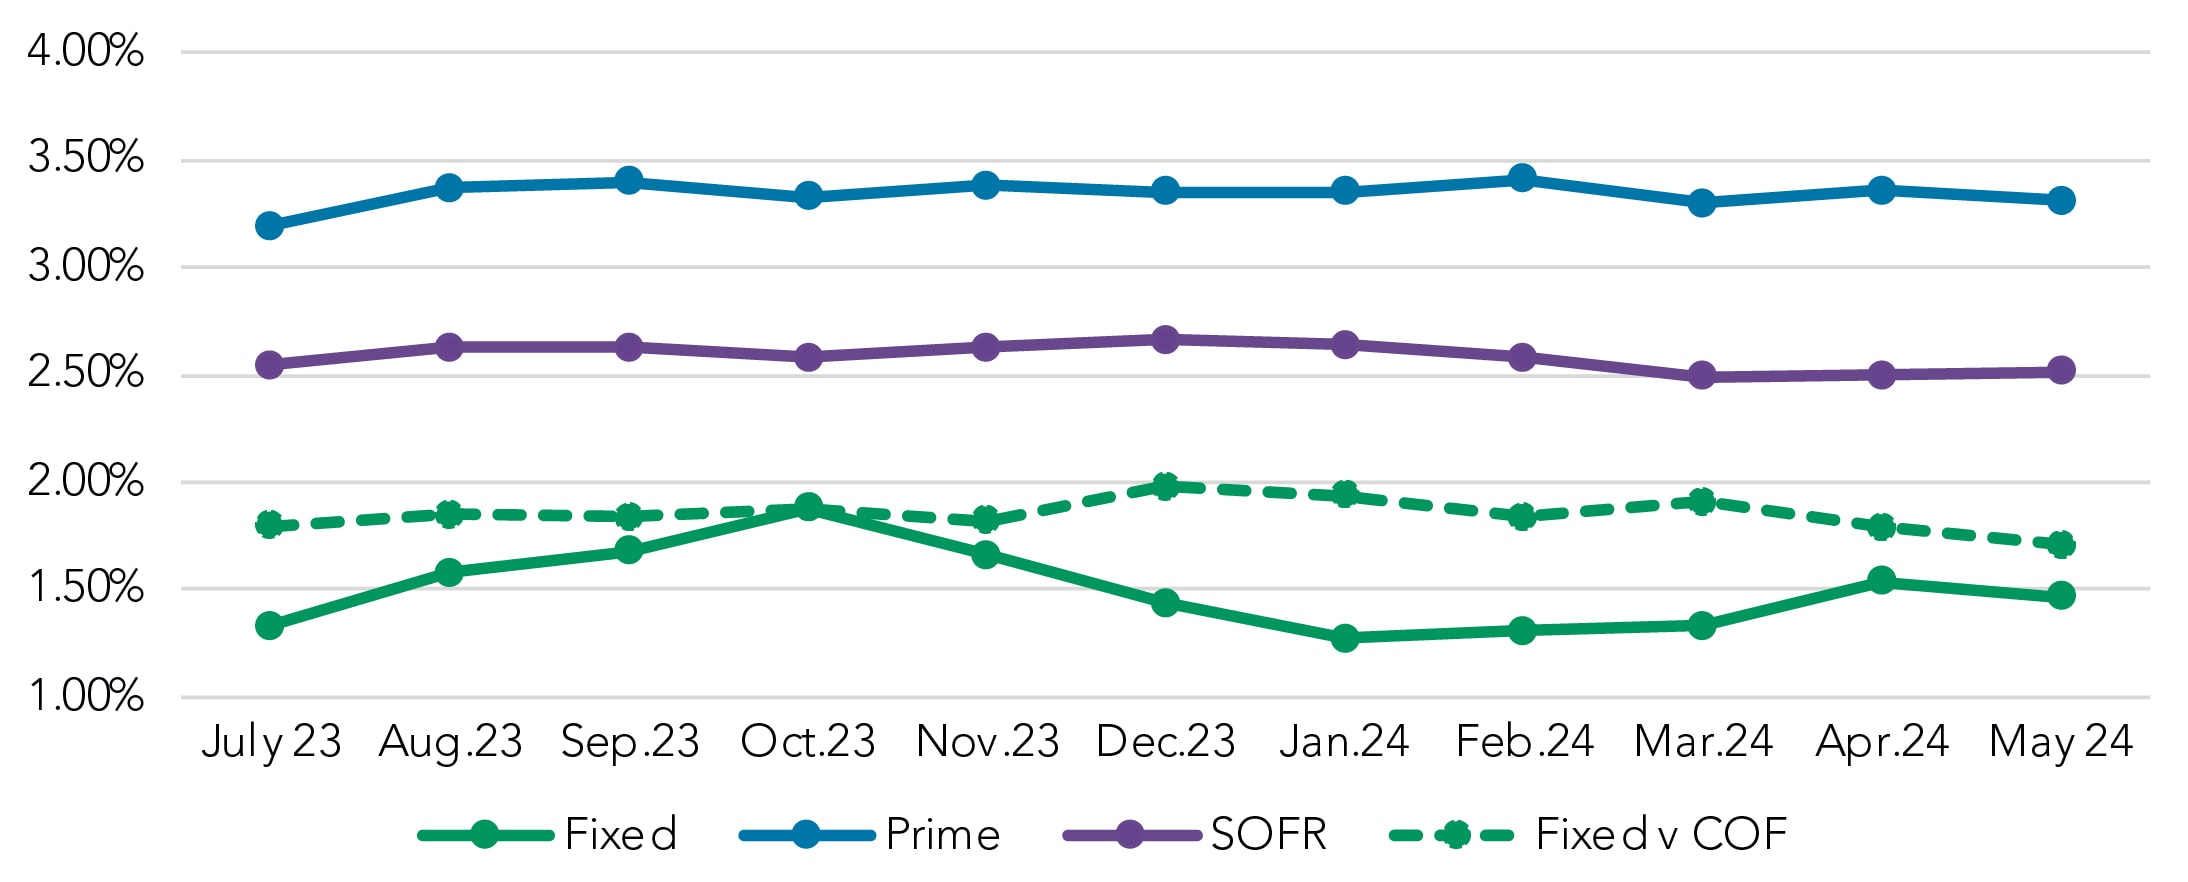
Meanwhile, a central measure of revenue – the SOFR equivalent spread by structure type – has been essentially flat for the past 11 months. This is measured as the rate type coupon minus SOFR=5.31%
SOFR Equivalent Spread by Structure Type
… While there’s been little change for coupon rates …
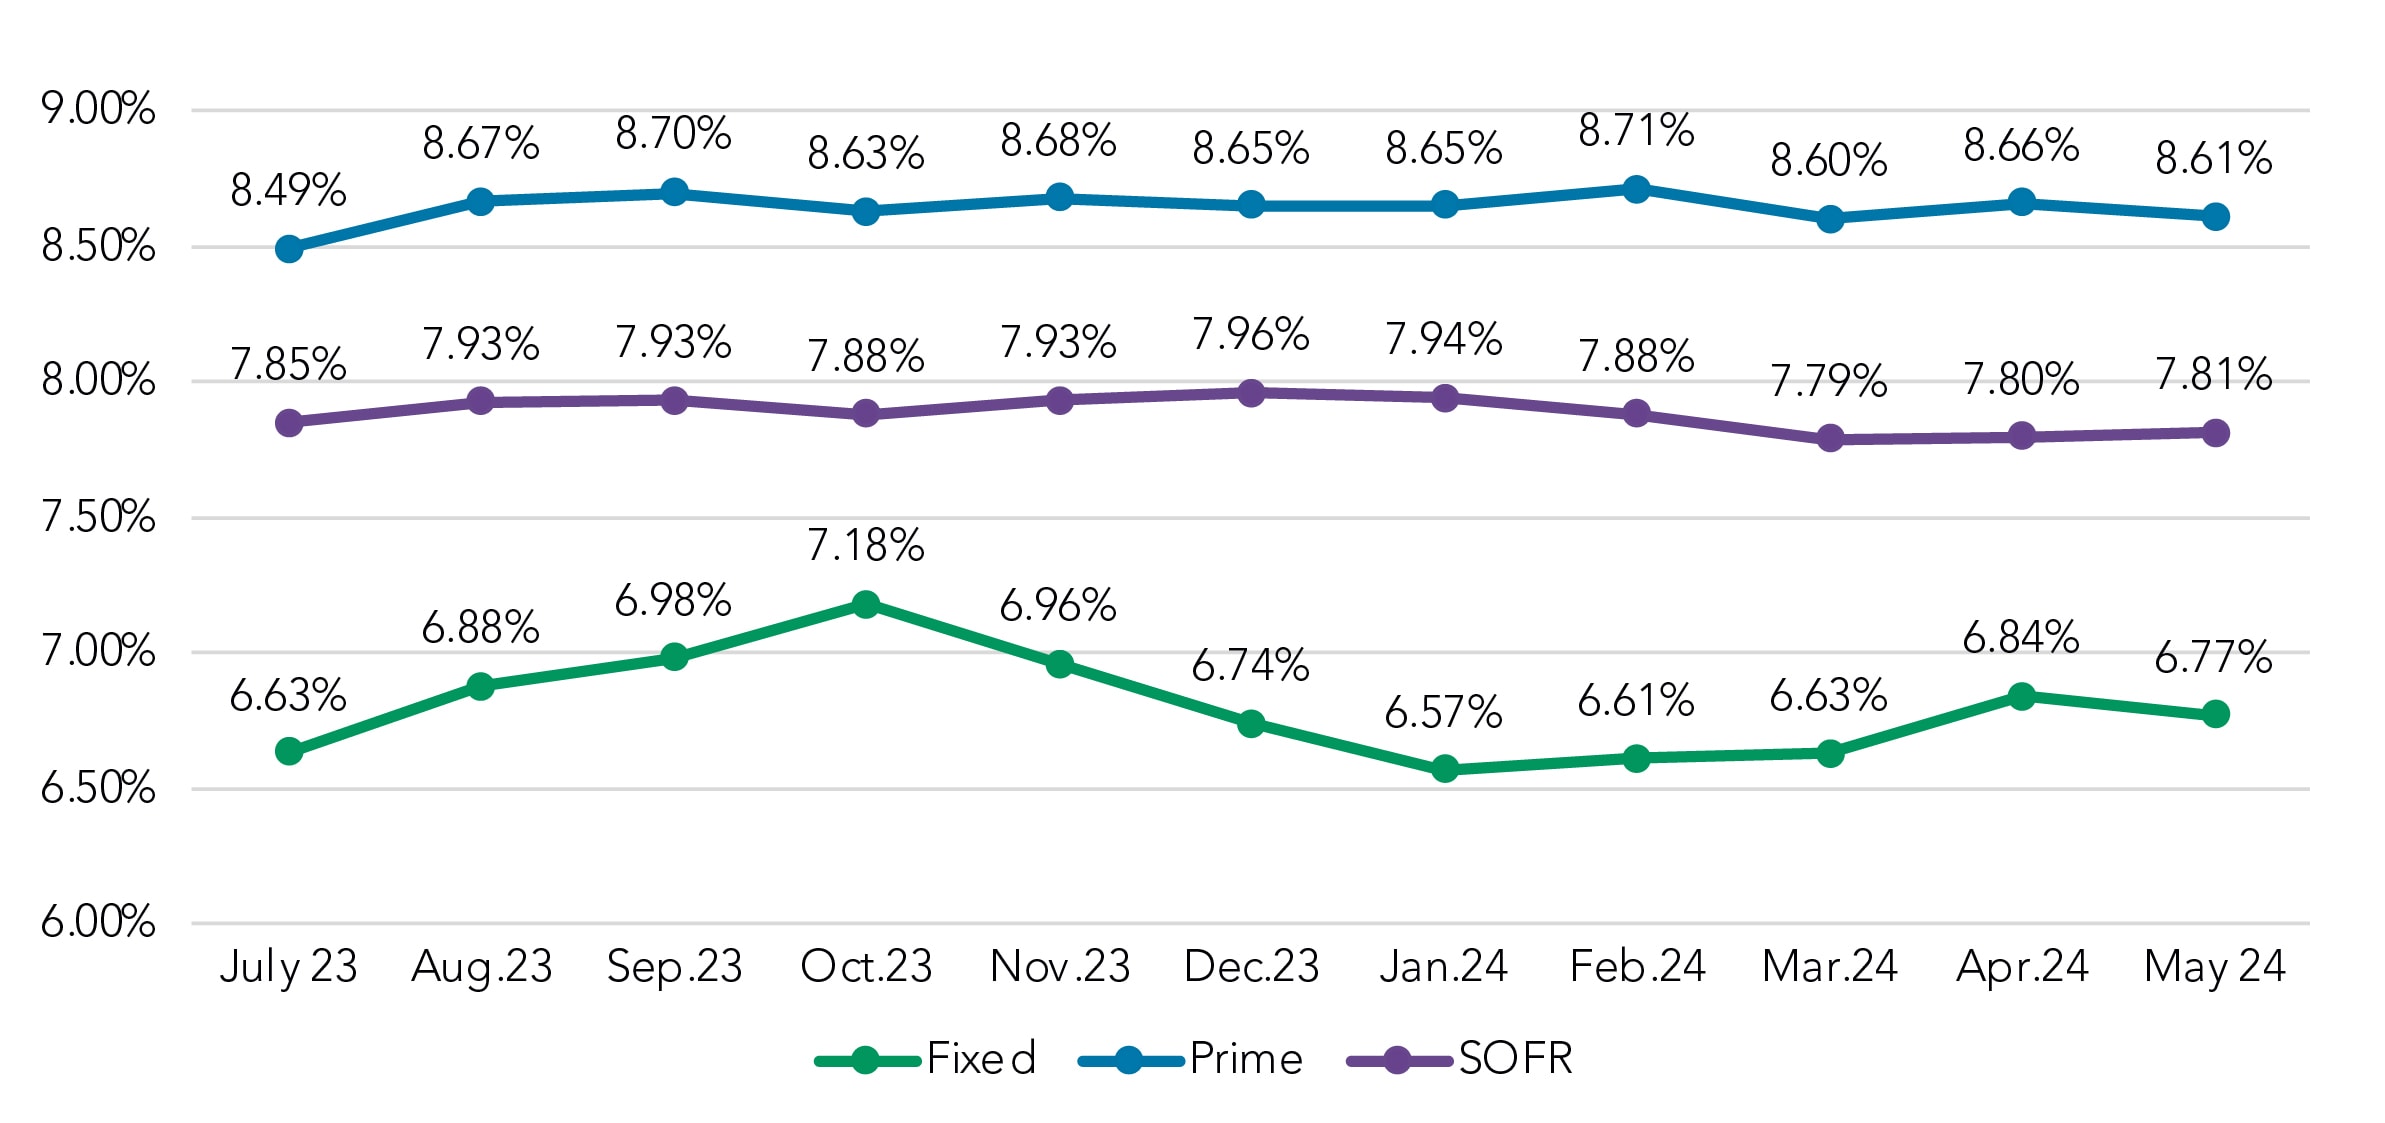
With SOFR largely unchanged since July, and spreads to SOFR and Prime unchanged, it then follows that floating coupon rates have largely been static as well.
The exception has been the rise of the fixed rate coupon prior to October 2023 and its subsequent decline, but the net result is that the May 2024 fixed-rate coupon (6.77%) is just 14 basis points higher than the July 2023 coupon (6.63%) and more than 100 bps below the SOFR equivalent.
Coupon Rate by Month, Rolling Trend
… Which made us wonder about selectivity
Since coupons haven’t shifted much, spreads have been steady, and pricing volume has risen throughout 2024 so far, how do we square that with the stated goal of many FIs this year: greater deal selectivity?
As a proxy for selectivity, we examined the ready-to-close status on fixed-rate loans, year-to-date.
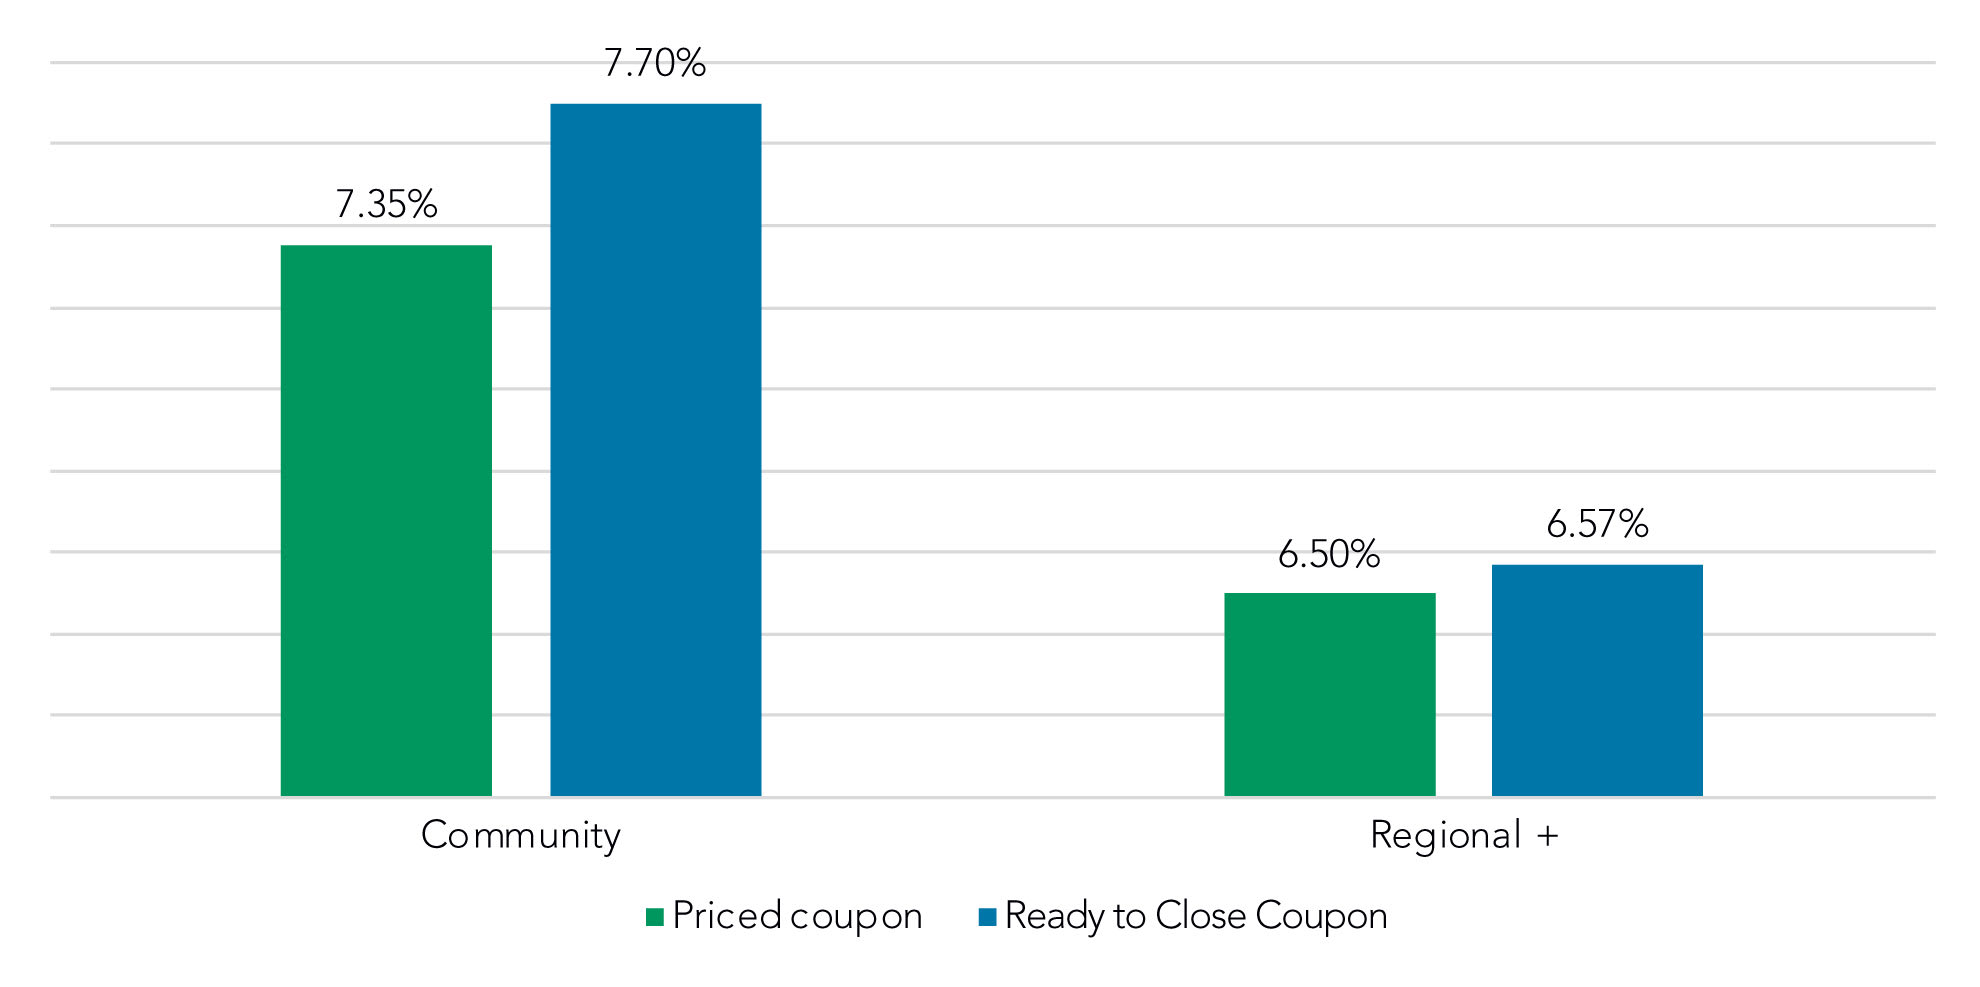
We found that for the community bank segment, selectivity played a larger role in the review process for fixed-rate loans, as ready-to-close loans were 35 basis points higher than the cohort of loans in the pipeline. For regional+ banks, similar loans had only a 7-bps lift from pipeline to ready to close.
Community FIs were already getting a higher priced coupon (+85 bps) than their Regional+ counterparts. They have then showed additional selectivity on the deals they’ve marked “ready to close.”
Approximate Lift in Fixed Rate Coupon for Ready-to-Close Loans
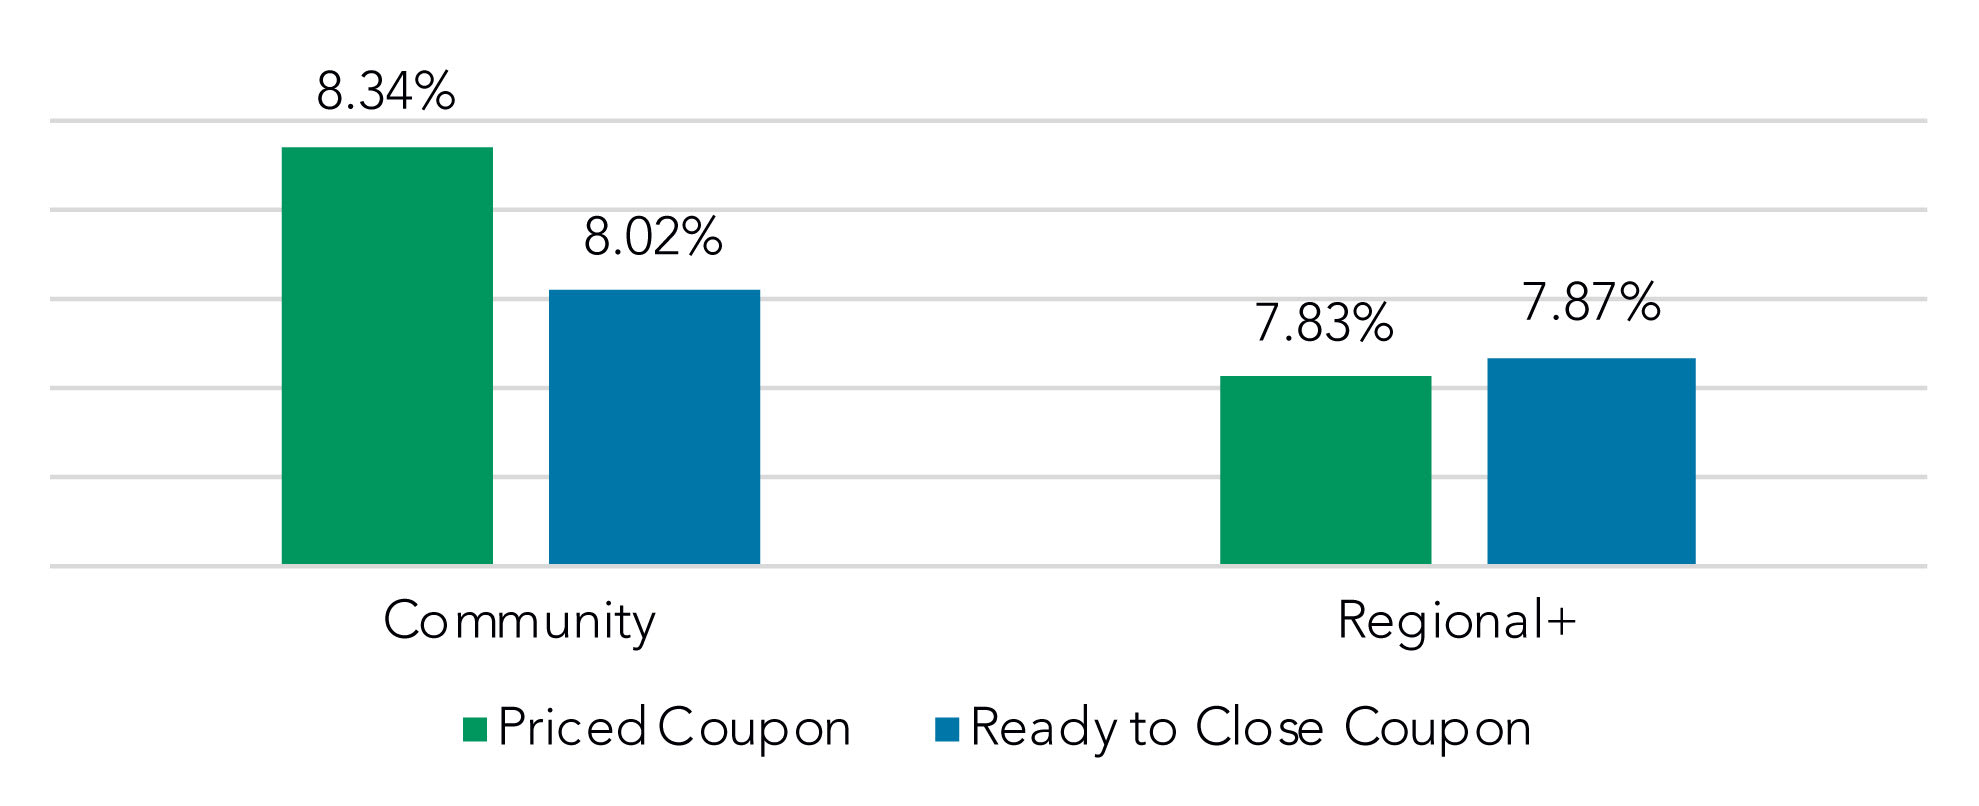
It’s a different story when it comes to SOFR-based floating-rate loans. While community institutions initially seek a higher coupon than regional+ institutions (8.34% vs. 7.83%) the coupon rate on the SFOR loans the community segment marks as ready to close drops by 32 basis points. Regional+ SOFR loans experience a modest coupon increase (4 bps) from pipeline to closed won.
Coupon Comparison on Priced vs Ready-to-Close SOFR Loans
A closer look at interest rate floors, by segment
With bankers anticipating future rate cuts, we checked on the use of interest rate floors on floating rate loans in priced opportunities.
While the use of the interest rate floor feature in the PrecisionLender pricing platform is not a required field, we feel it’s still worth reporting on, as a way gauging shifts in banker awareness for potentially protecting yield down the road.
We also looked at floor behavior only among community (<$8B in assets) and regional ($8-50B) institutions. Institutions over $50B capture interest rate floor information in their pricing activity in PrecisionLender far less than the other segments. Thus, we chose not to report on this segment.
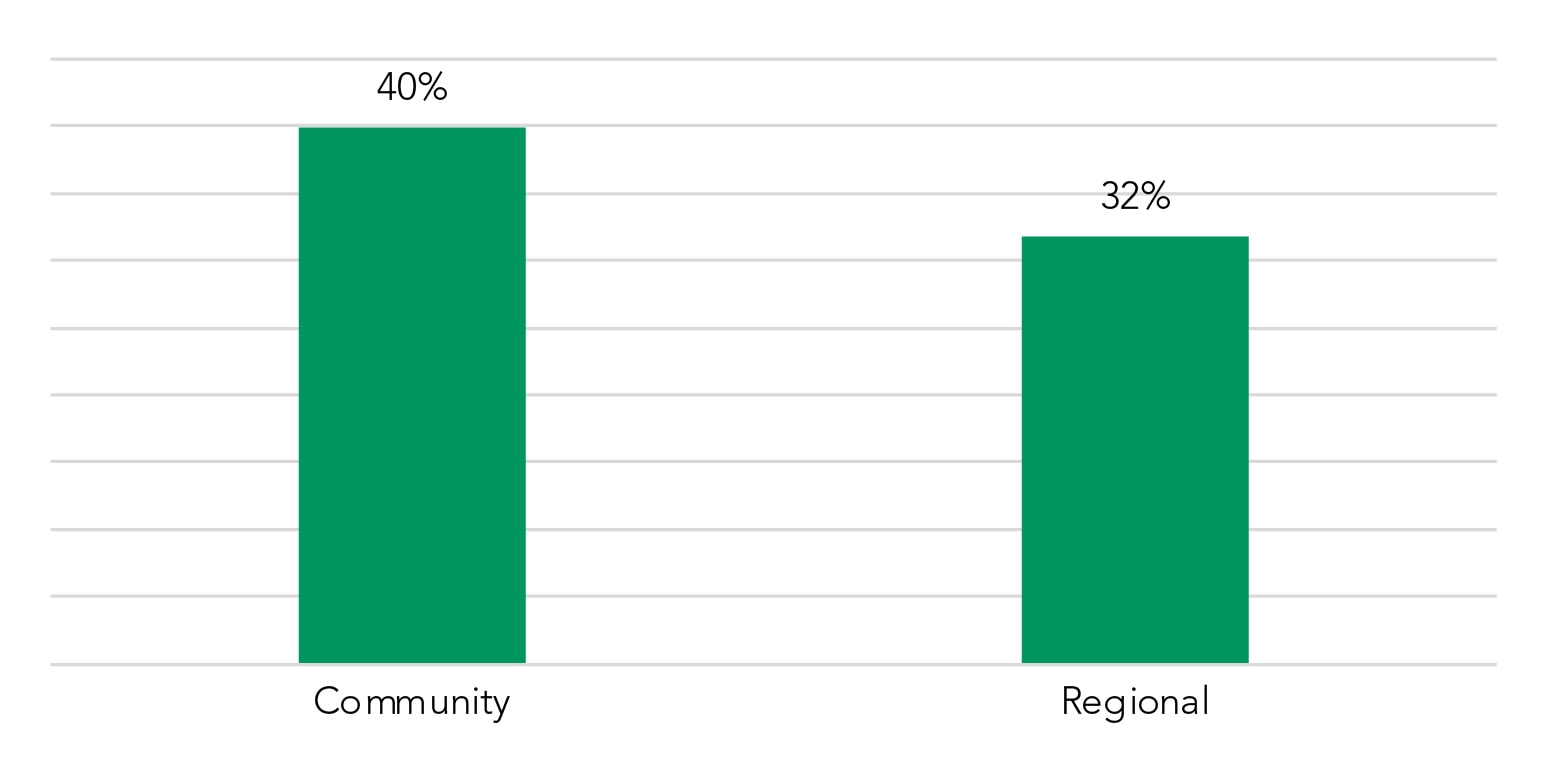
We looked at monthly activity year-to-date and found no change in overall frequency of floor rate so far in 2024. However, year-over-year the percent of loan balances protected by floors is up from 37% to 40% for the community segment, while it’s risen from 28 to 32% the regional segment.
Percent of Amount Priced with Floor in 2024
Floating Rate Loans
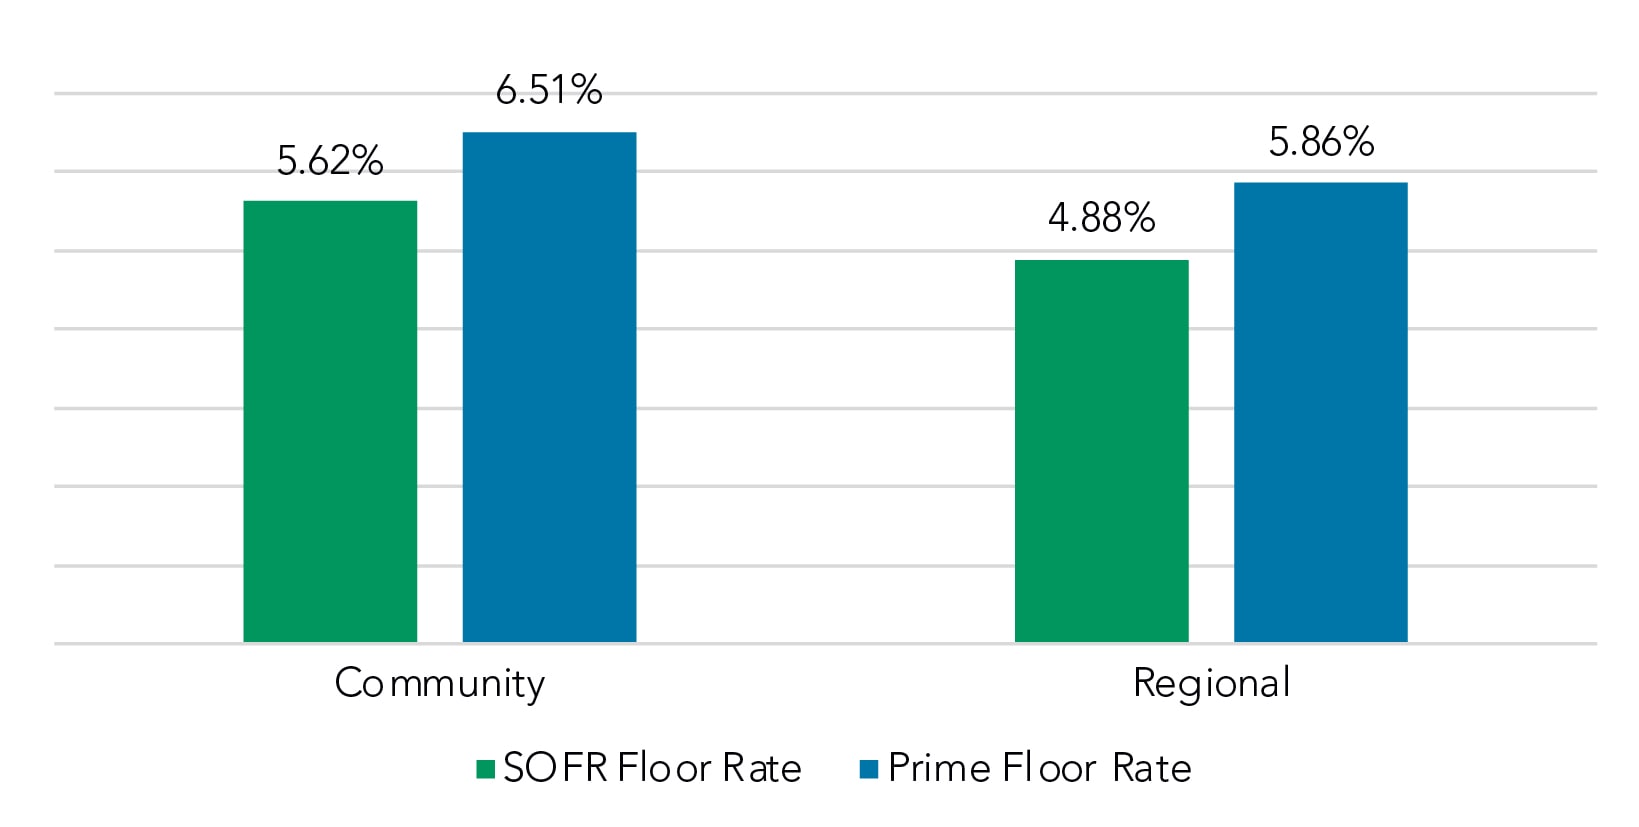
We also found across segments that the floor rate in use for Prime loans is about 100 bps higher than its SOFR counterpart.
In all cases, the observable floor employed by bankers in pricing conversations is approximately 275-300 bps below the current coupon rates for the loans being priced.
Average Floor Rate in 2024
Floating Rate Loan Pricing
A two-pronged impact on deposit costs
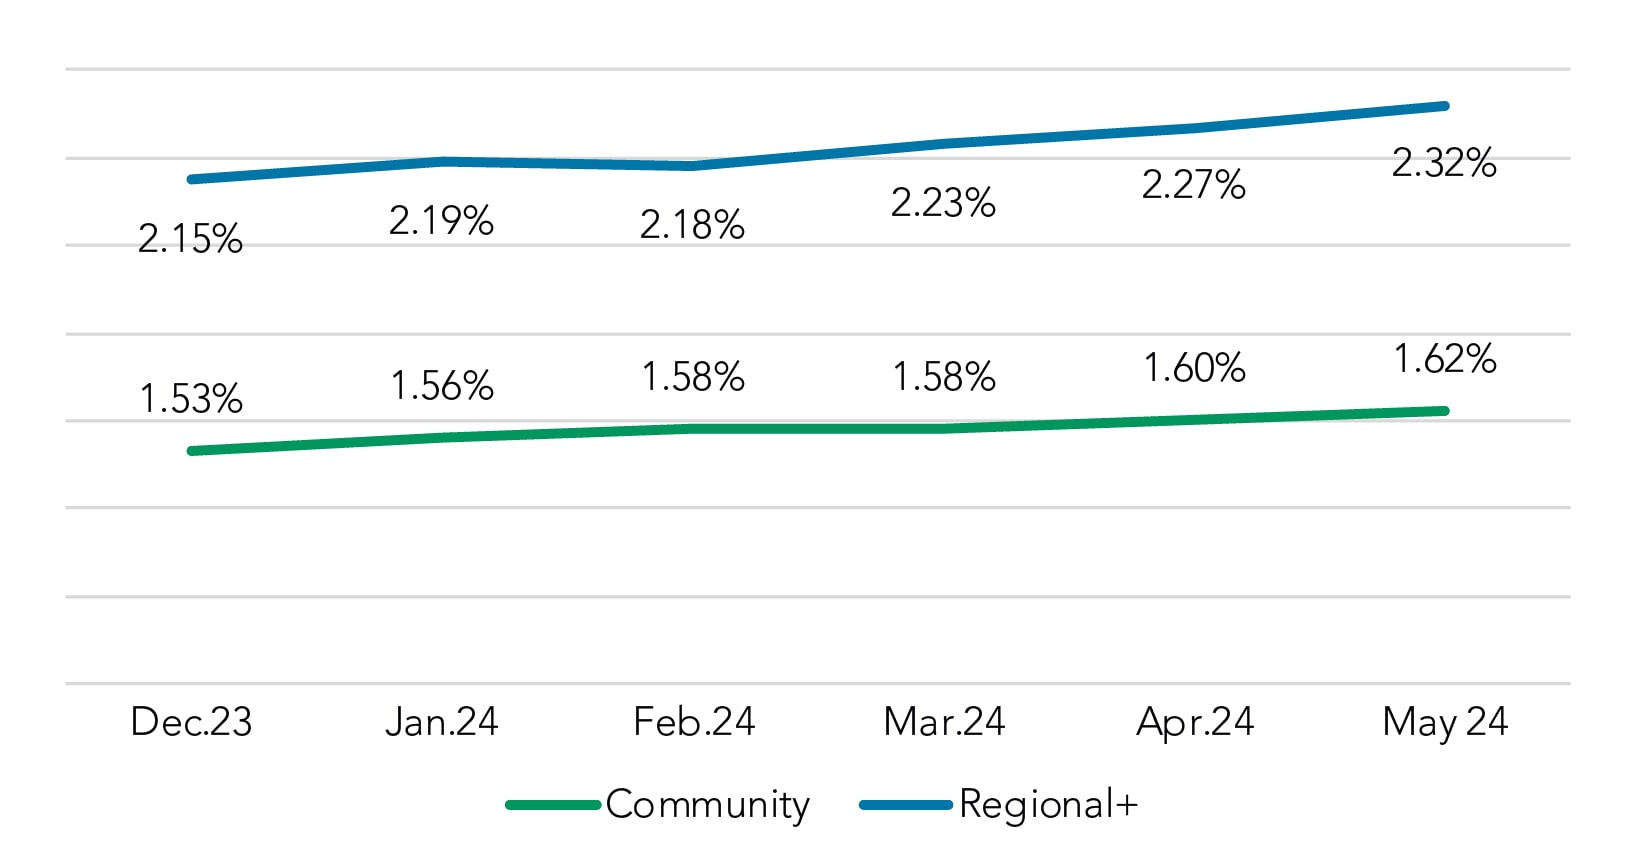
Looking at how much FIs are paying for deposits, the PrecisionLender data shows a 17 bps increase year-to-date among the Regional+ segment, while their Community counterparts have experienced a 9 bps increase.
The deposit categorization in PrecisionLender relies on the deposit account interest rate rather than a product name or code. Generally, interest rates < 10 bps are considered NIB.
Overall Deposit Rate Paid
(Includes NIB Base)
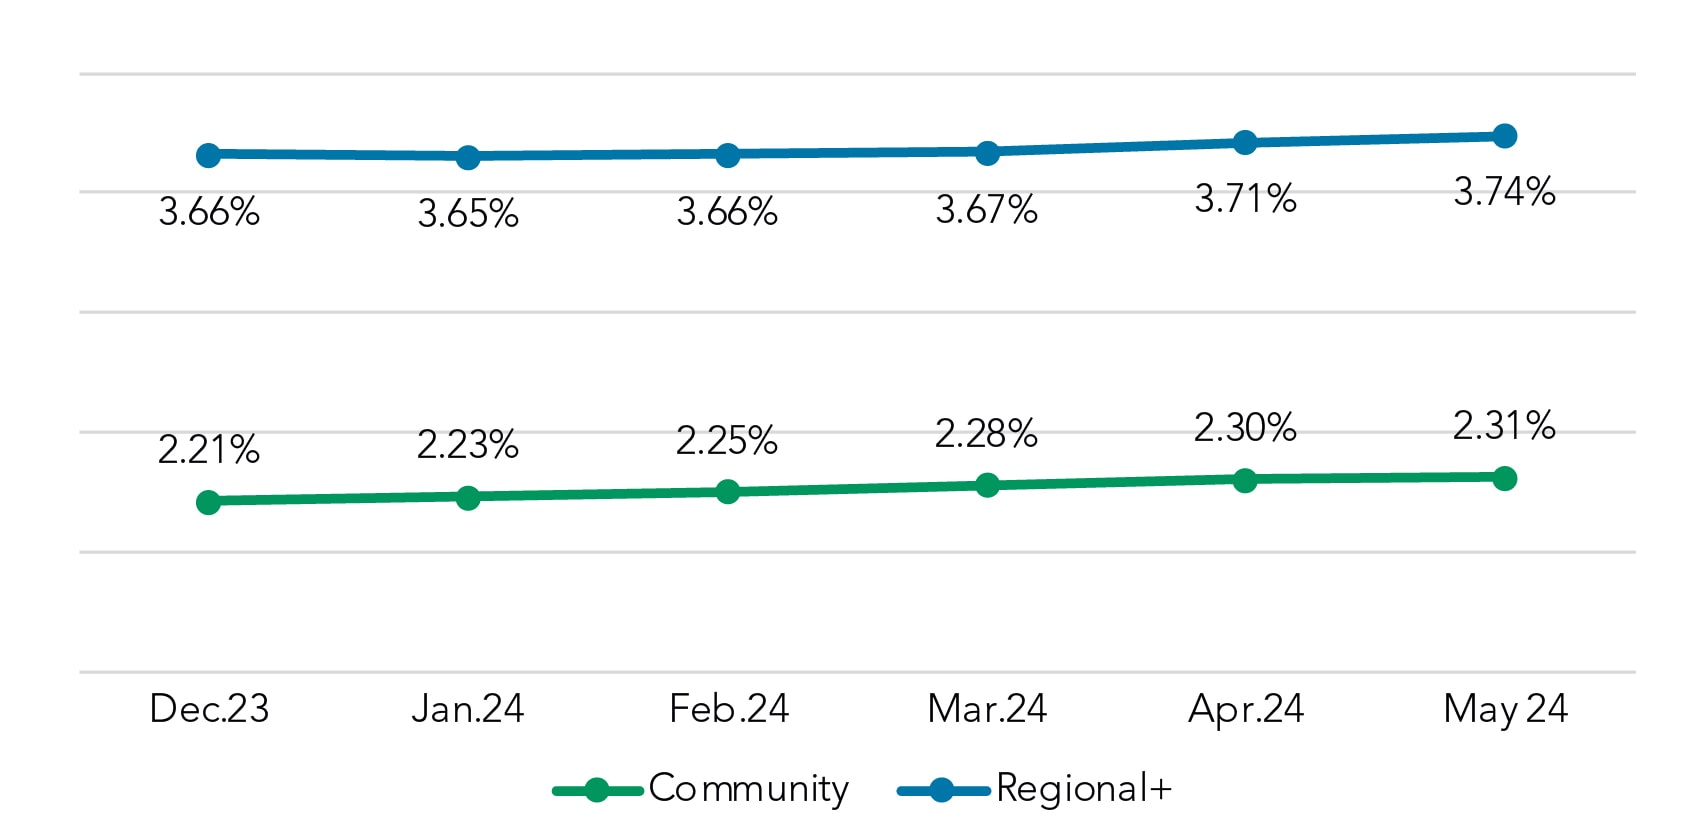
However, the interest-bearing cost increases appear to have slowed month over month—adding only 3 bps in May vs April for the Regional+ segment to 3.74%.
Interest Bearing Non-Time Rate Paid
(MMDA, CWI, Savings)
Finally, the share of interested-rate deposits in the overall mix has increased, year-to-date, by 3%, up to 59%. That mix shift is a second force, along with incremental increases in interest-bearing deposit rates paid, that is driving higher overall costs.
Got Questions?
Our banking consultants and data scientists are combing through Q2 PrecisionLender pricing data every day. If there is anything you’d like to know about what they’re seeing, please send your questions to insights@q2.com.