Commercial Loan and Deposit Pricing Market Update: February 2025
For our February analysis of the Q2 PrecisionLender commercial loan and deposit pricing database, we looked at the coupon and NIM gaps between pandemic-era fixed rate loans that are rolling off the books and loans being priced/repriced in a higher rate environment in 2025.
We also looked at what's happened with spreads, as well as deposit rates, so far in 2025.
Read on to get more details.
Data Notes:
• When we discuss the cost of funds (COF) on loan pricing activity, we refer to the marginal duration matched funding cost employed in pricing, not the bank’s actual average cost of funds.
• We define Regional+ as institutions with $8B+ in assets, while Community are <$8B.
Pricing volume increases
As expected, pricing volume bumped back up in January after the typical end of year drop. It’s worth noting that the January volume was not just above November/December levels but was also the second highest monthly mark since the start of 2024.
Priced Commercial Loan Volume in $
Indexed to January 2024 = 100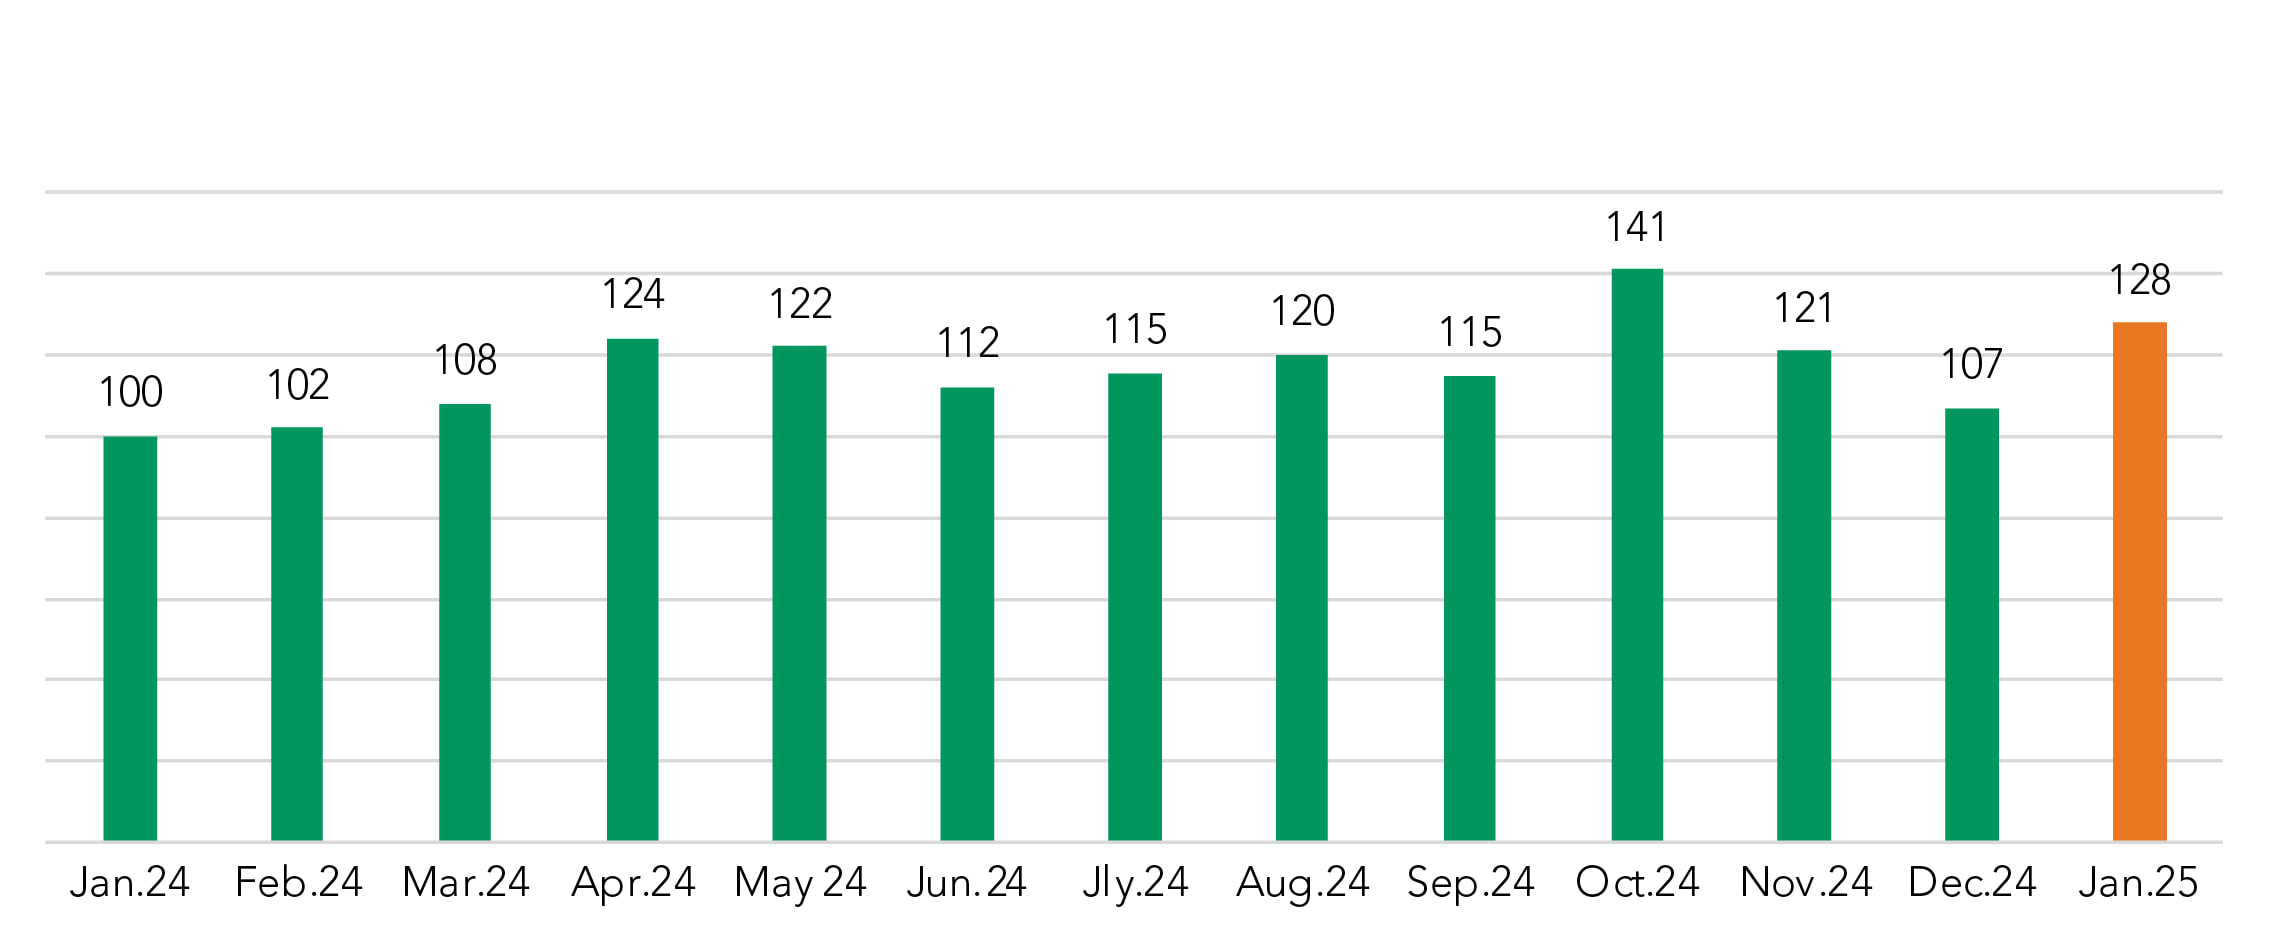
After this month we’ll be shifting to using July 2024 as the new index baseline for monthly volume comparison, as it is (obviously) more recent than January 2024 and is more accurate as it includes institutions added to the PrecisionLender database in the 1H 2024.
Priced Commercial Loan Volume in $
Indexed to July 2024 = 100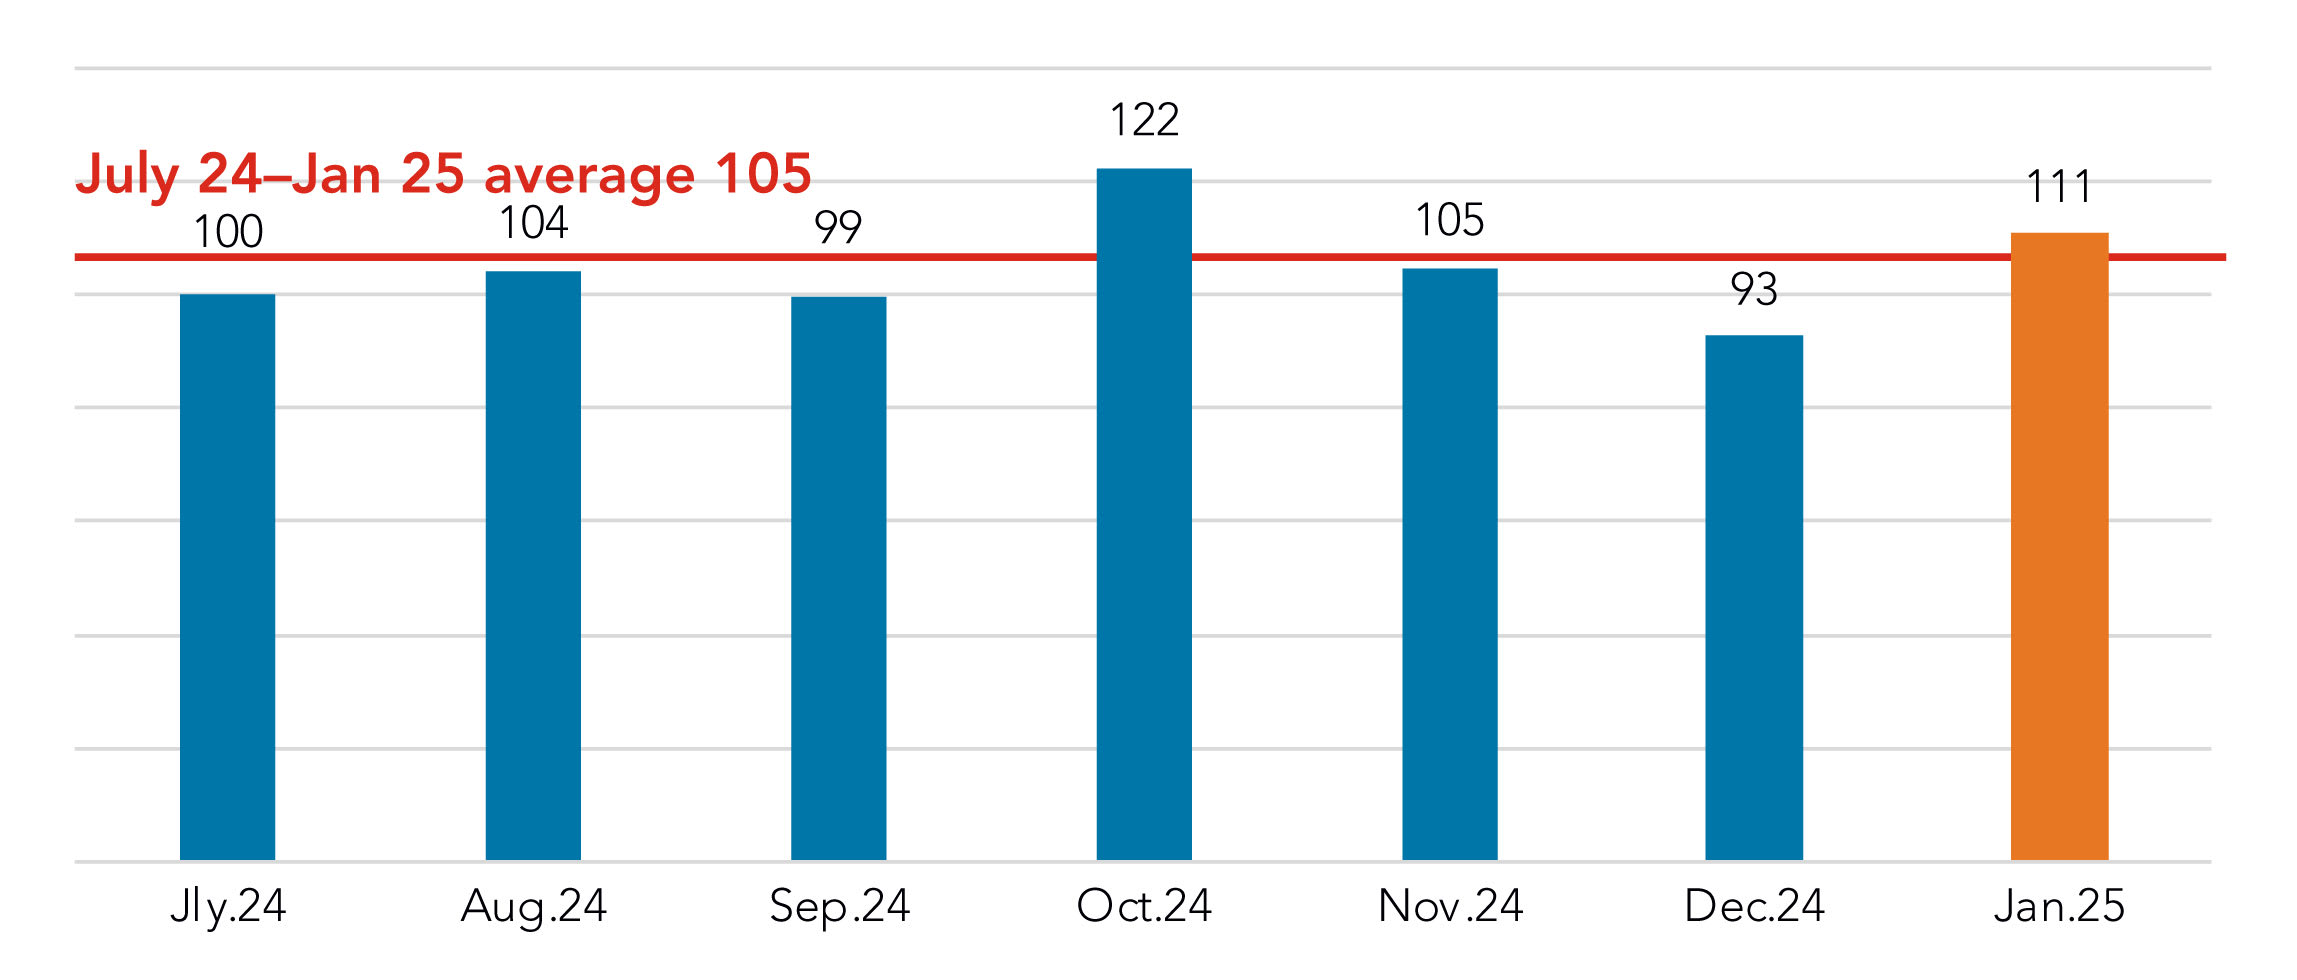
Fixed-rate roll-off loans vs. new/replacement loans: NIM isn’t keeping up
We’ll start with the most pressing question we’ve been hearing so far this year: How do coupon rates and resultant net interest margin (NIM) for pandemic-eara loans rolling off the books in 2025 compare to the loans that are being priced/repriced now in a higher rate enviroment?
To support this question, we are adding a new review element for 2025. Some rules of the road to keep in mind in review of the analysis:
• The KPI will be the degree (+/-) to which original NIM compares with NIM for new and renewed loans. It is not a record-for-record match of matured loans and their replacement attributes.
• Using the December 2024 portfolio snapshot as the basis, we’ve aggregated 2025 roll off activity by quarter and presented static coupon measures associated with each quarter. These values may change as 2025 progresses due to early payoffs, curtailments, or other activity.
• We also used the December 2024 snapshot to capture the expected /implied interest rate shock for each quarter in 2025. This estimate may change as 2025 progresses: the expected rate shock now for 4Q25 will likely not be same then as it is today. Rate shock is an estimation of how much additional interest expense borrowers could face if they refinance their loans rolling off in 2025 at current market rates.
We will record how repriced/new loan activity compares in coupon and NIM to aggregate roll off. What we have below is admittedly an inexact measure – but it’s a way to give us a directional sense of what’s happening. It’s something we’ll continue to monitor and update going forward in 2025.
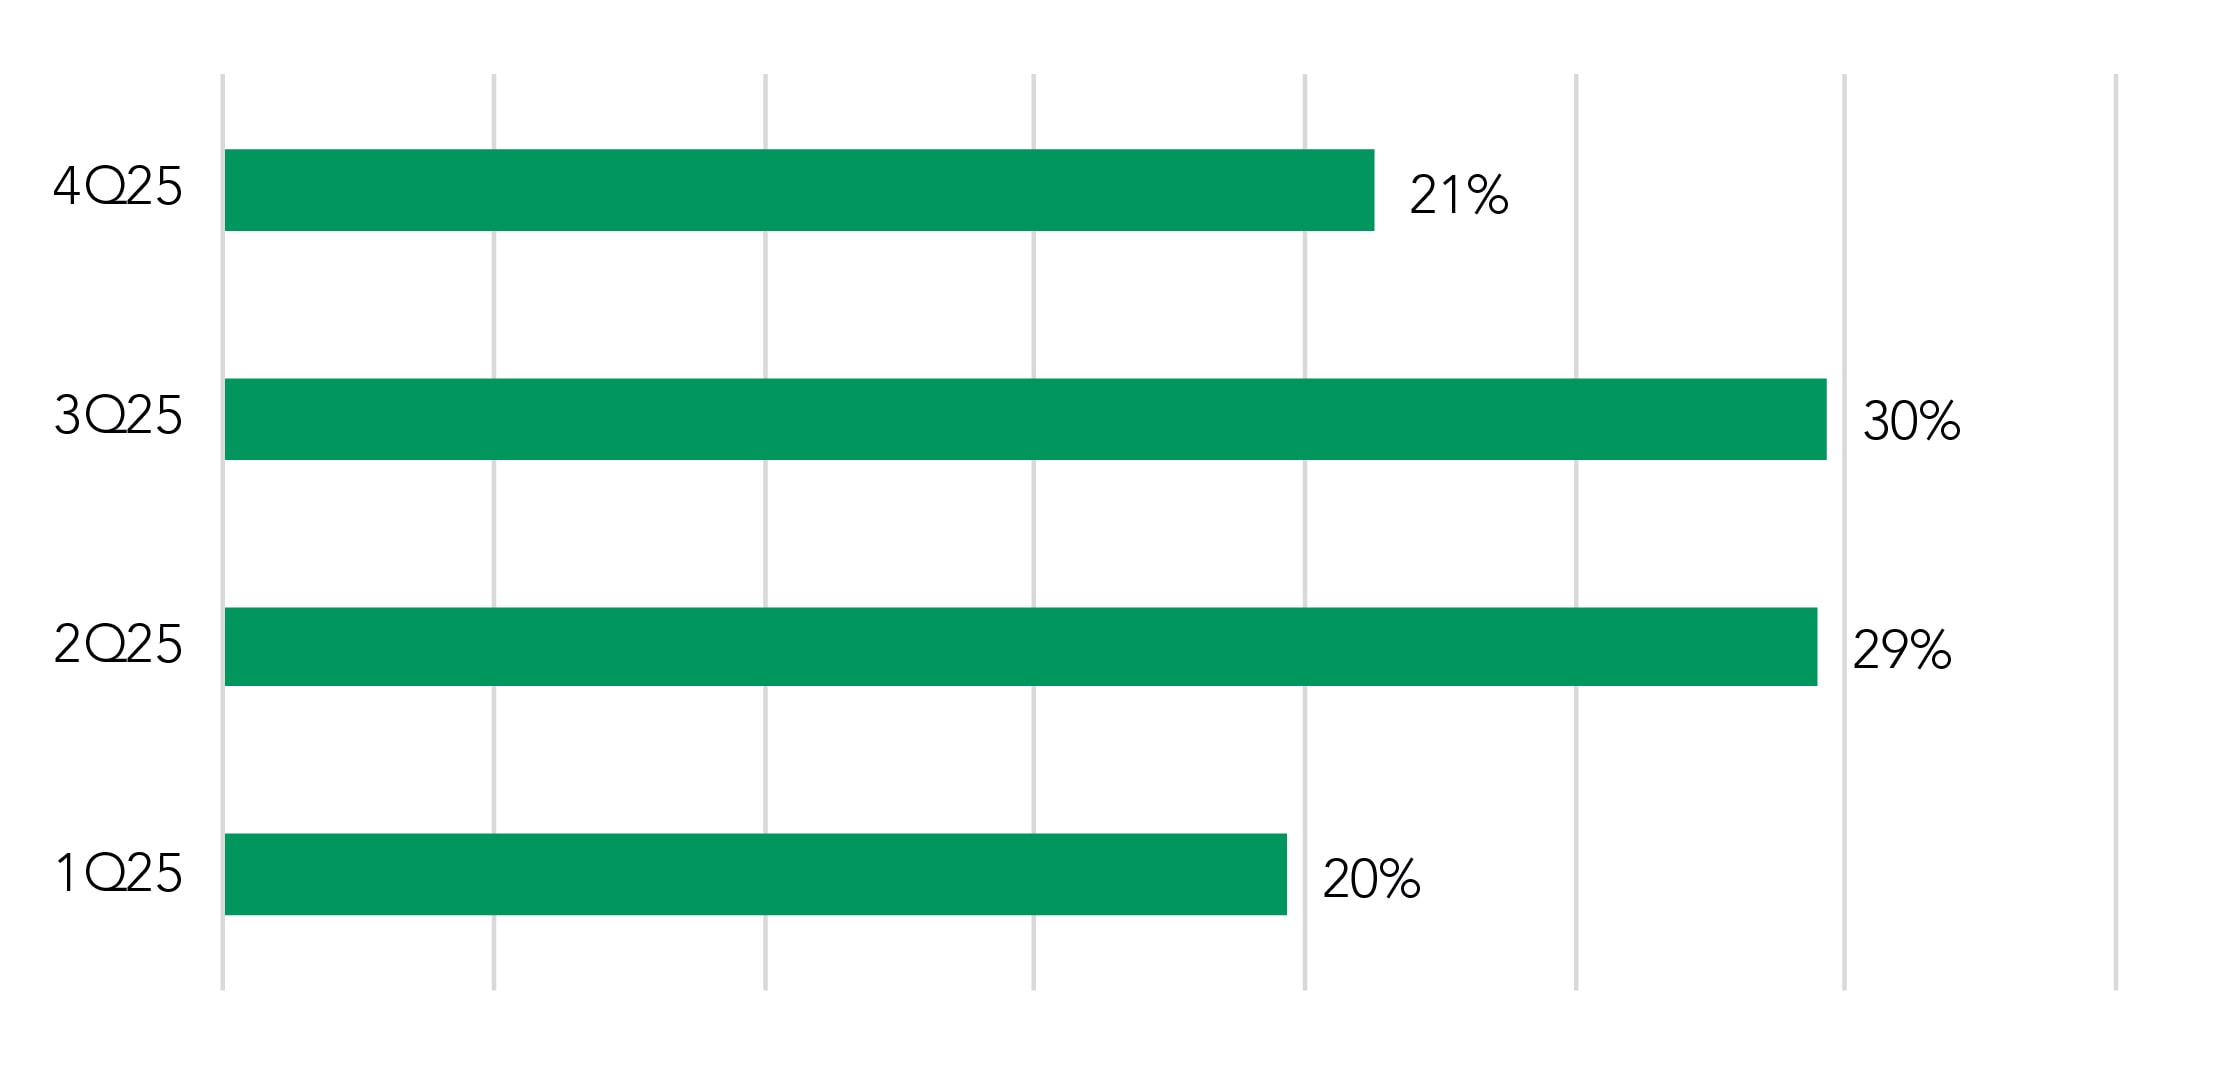
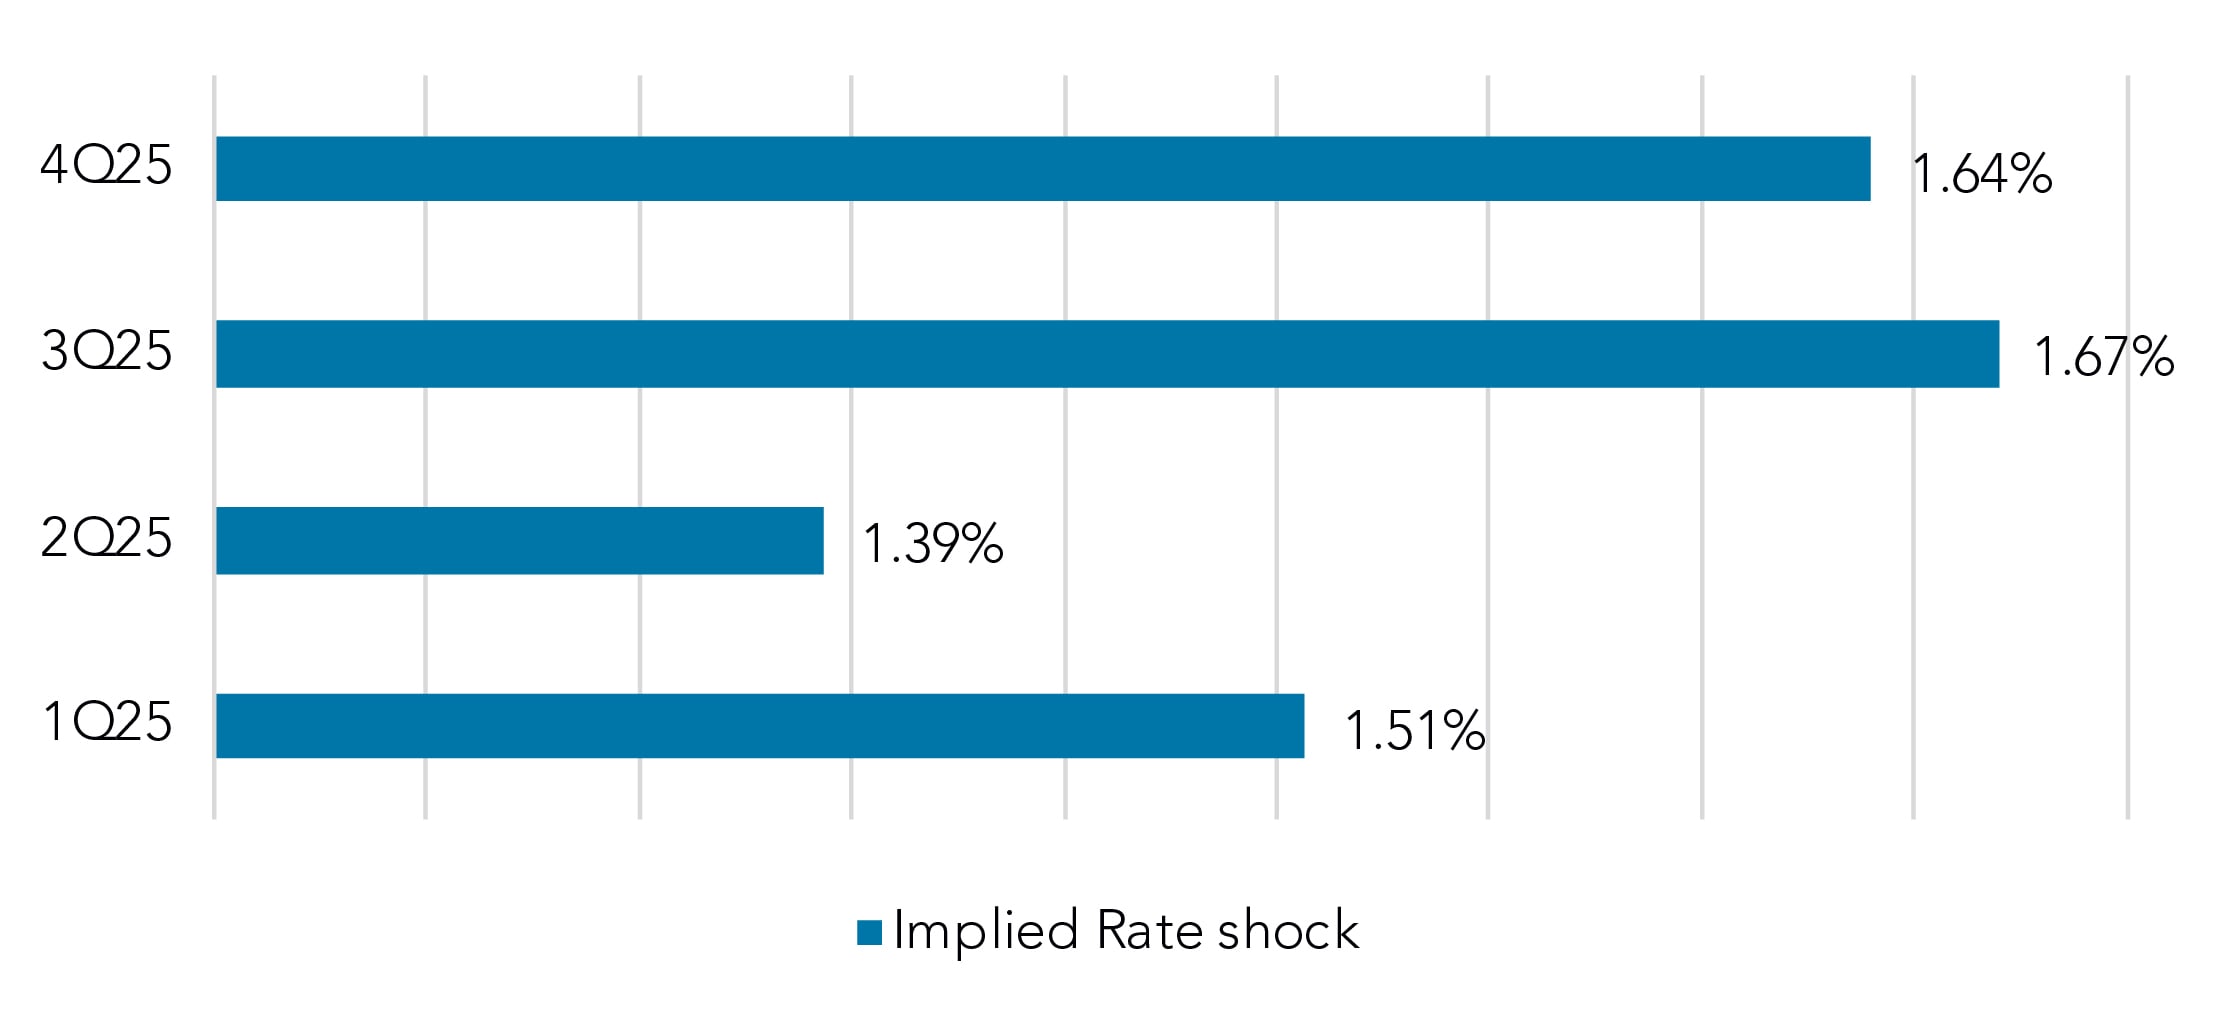
The overall landscape shows that most of this year’s roll off is concentrated in Q2 and Q3 of 2025 while the greatest implied rate shock is present in Q3 and Q4. (See two charts below).
This is something we’ll continue to monitor and update going forward in 2025.
Distribution of 2025 Fixed Rate Expected Roll Off
By Quarter
Implied Rate Shock on that Roll Off
By Quarter
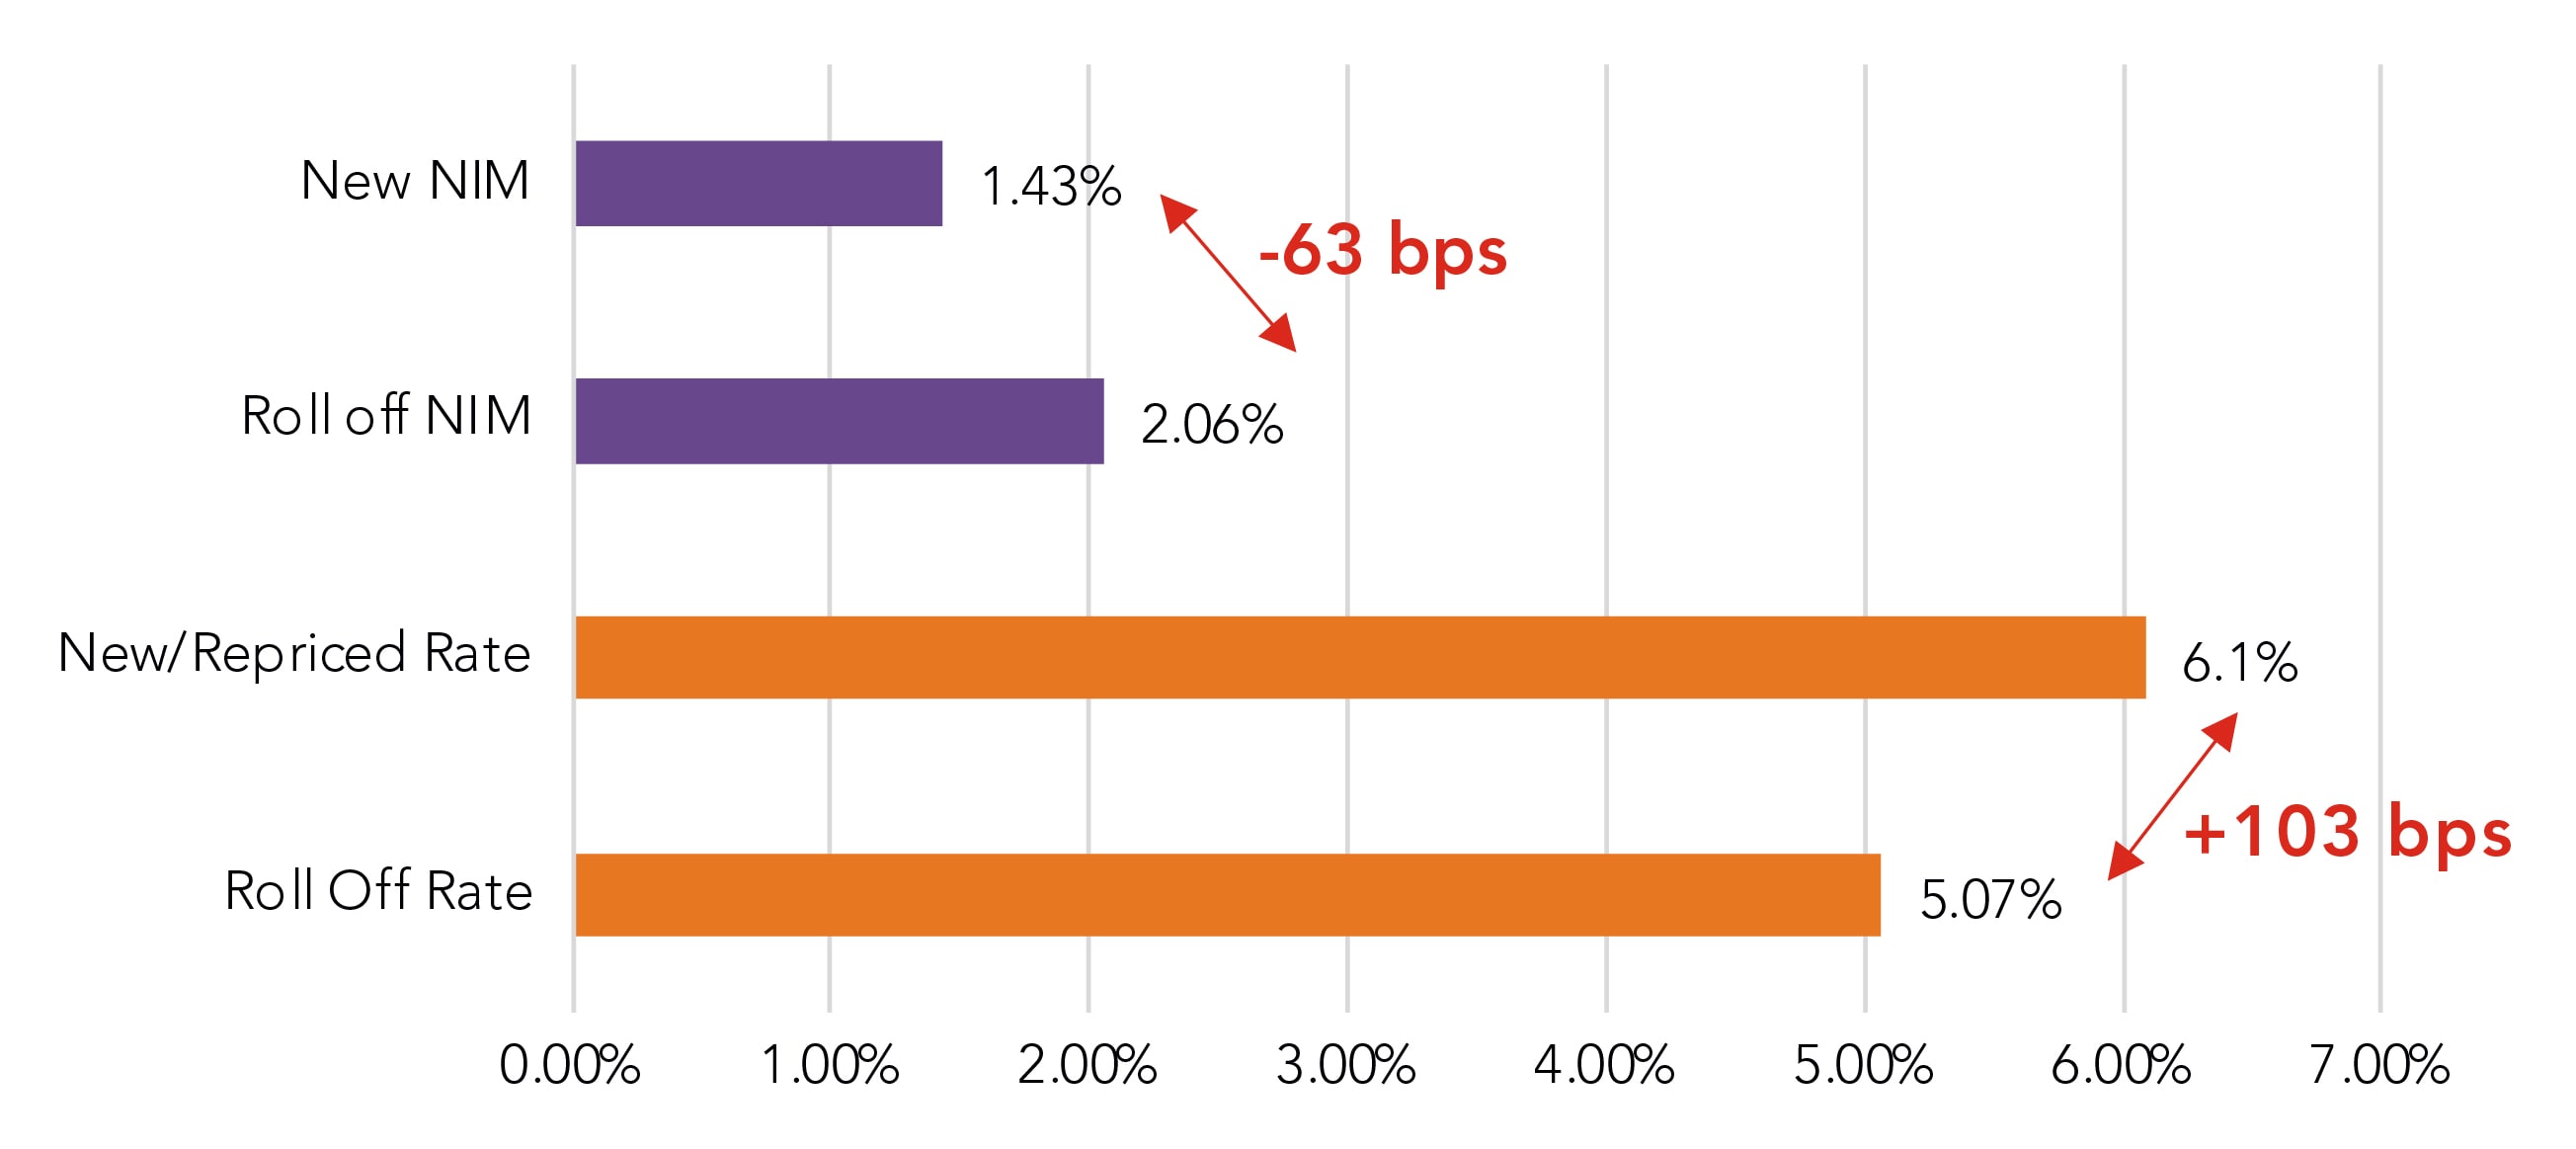
For January, we found that new fixed-rate loans were boarded at 6.1% . That’s up 103 bps from the expected roll off rate for fixed-rate loans during this period, but it’s short of the implied rate shock. The NIM on these new loans shows 143 bps is 63 bps lower than the loans rolling off (206 bps) . These results reflect January activity to date. We will add to the results as the year progresses.
NIM and Rates, Roll-Off vs. New
January 2025 activity for 1Q25
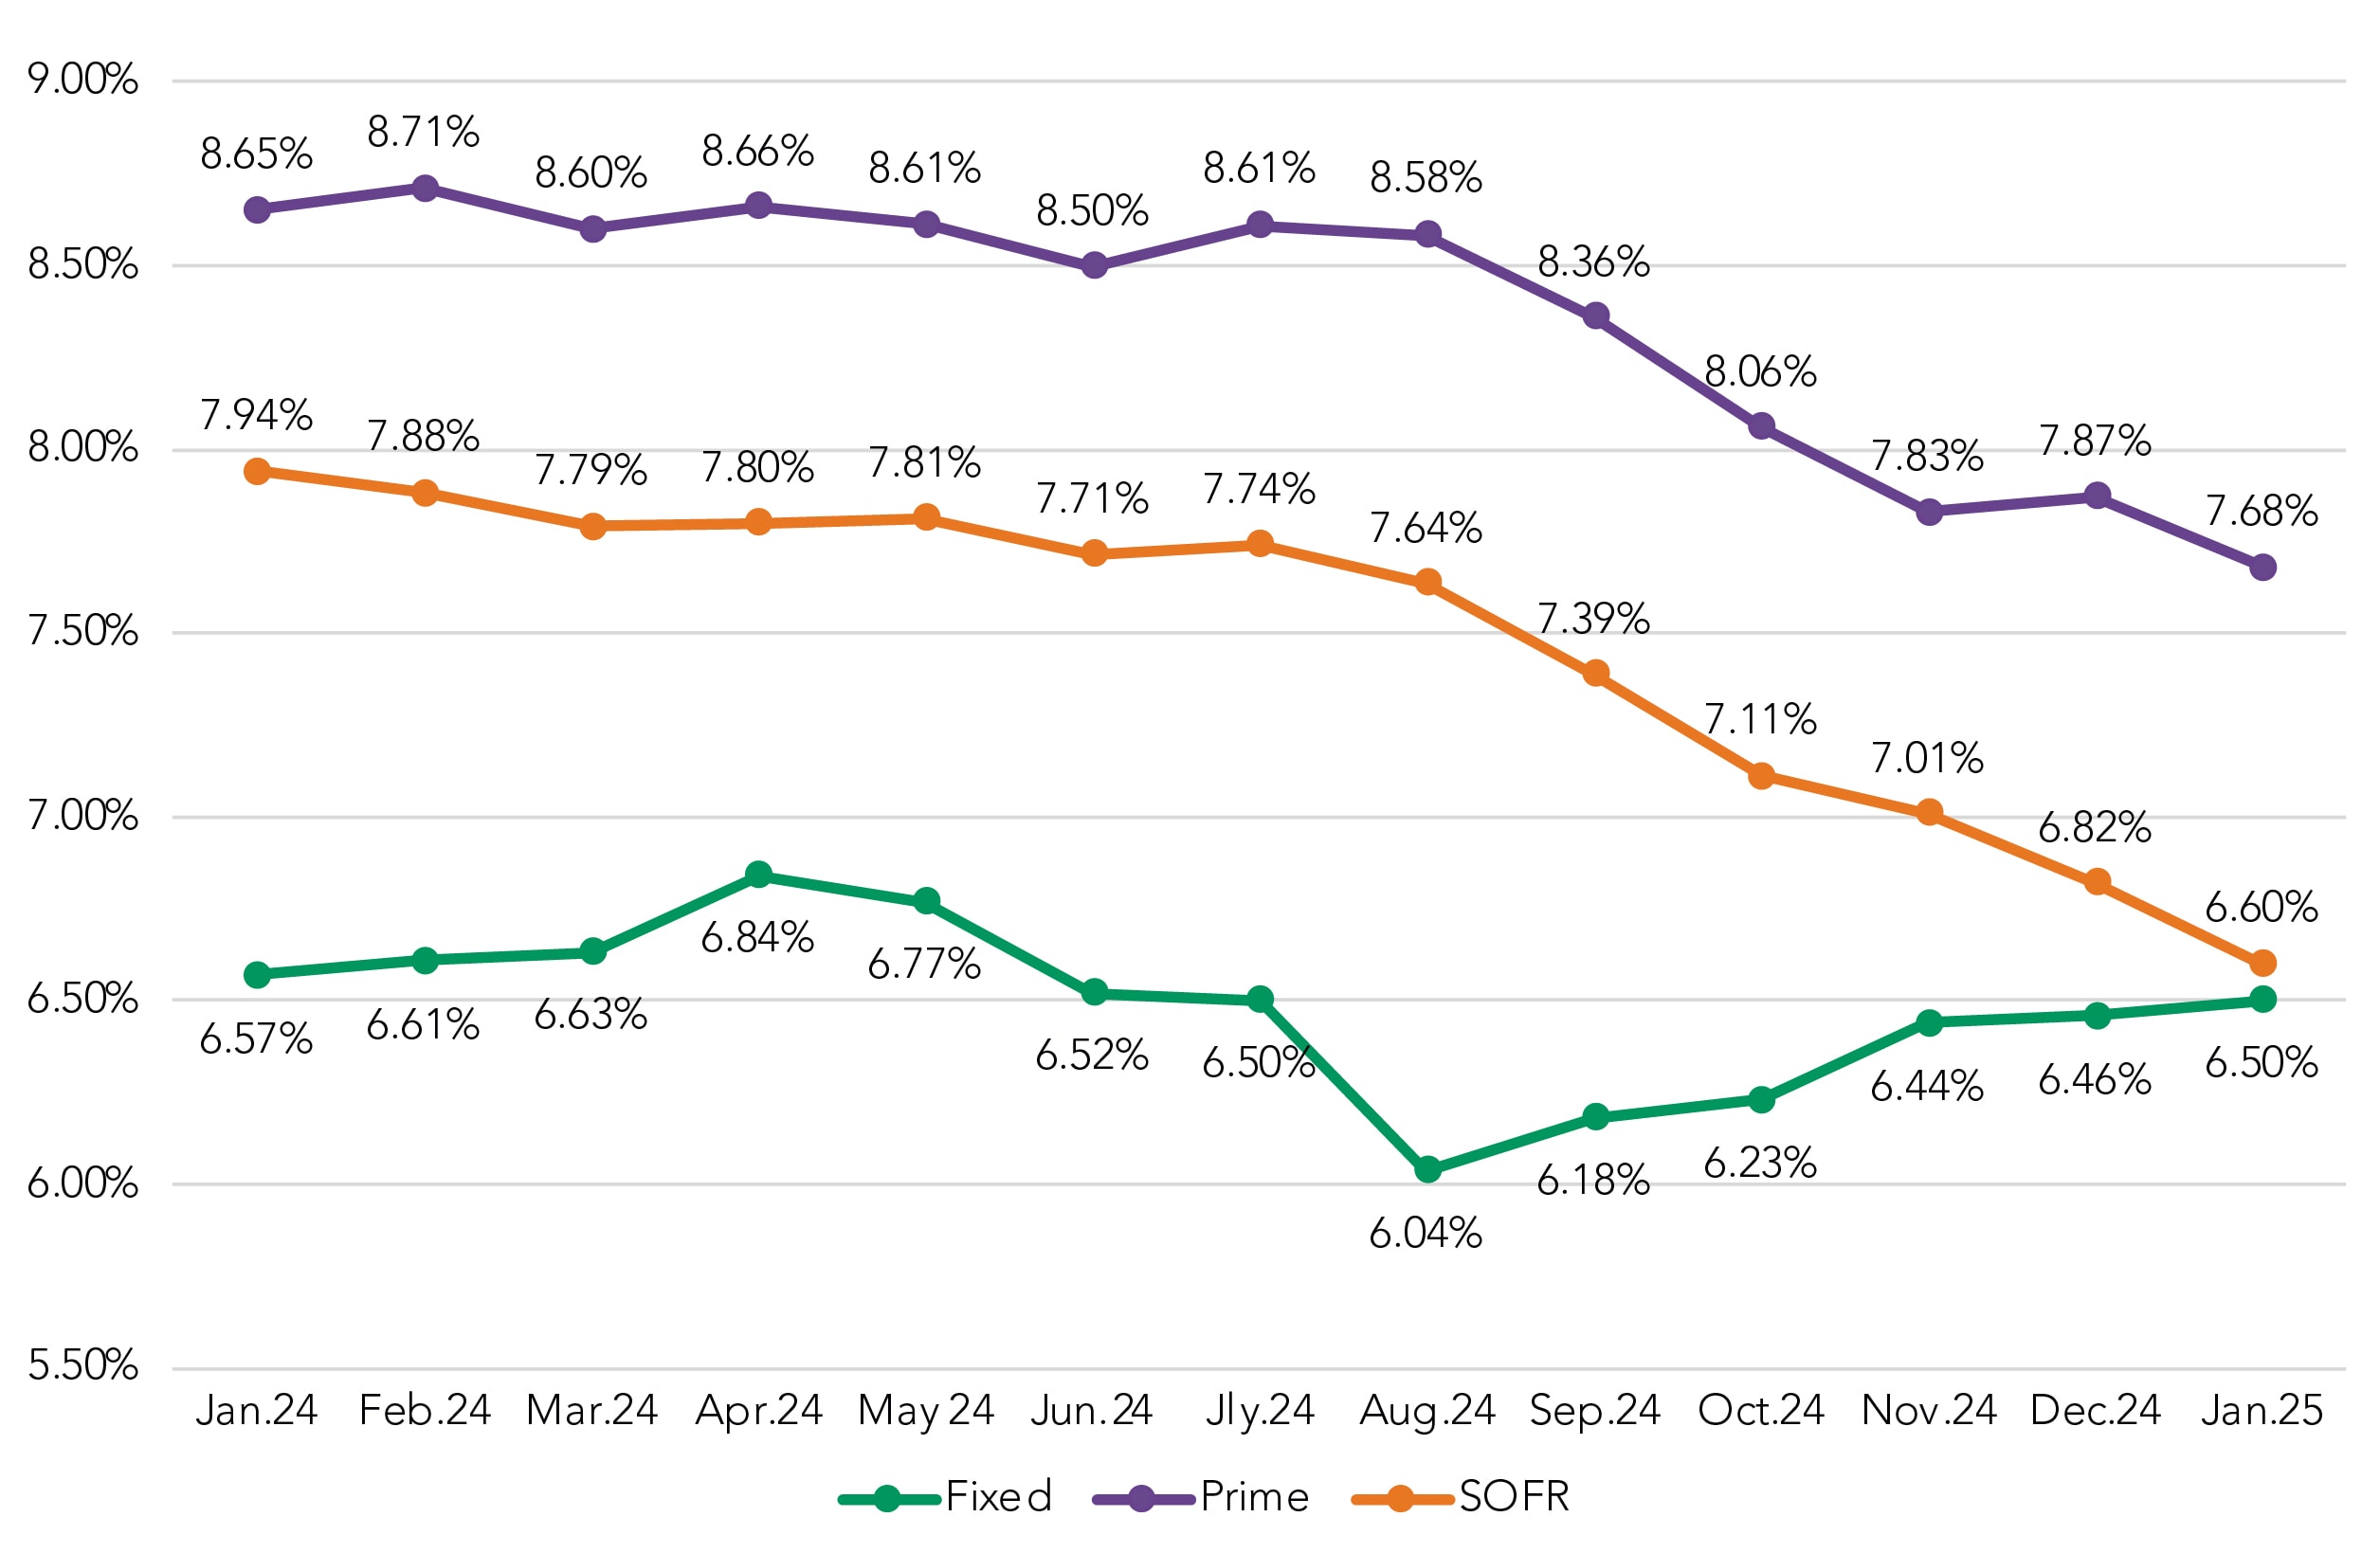
Coupon rates converge for fixed-rate and SOFR structures
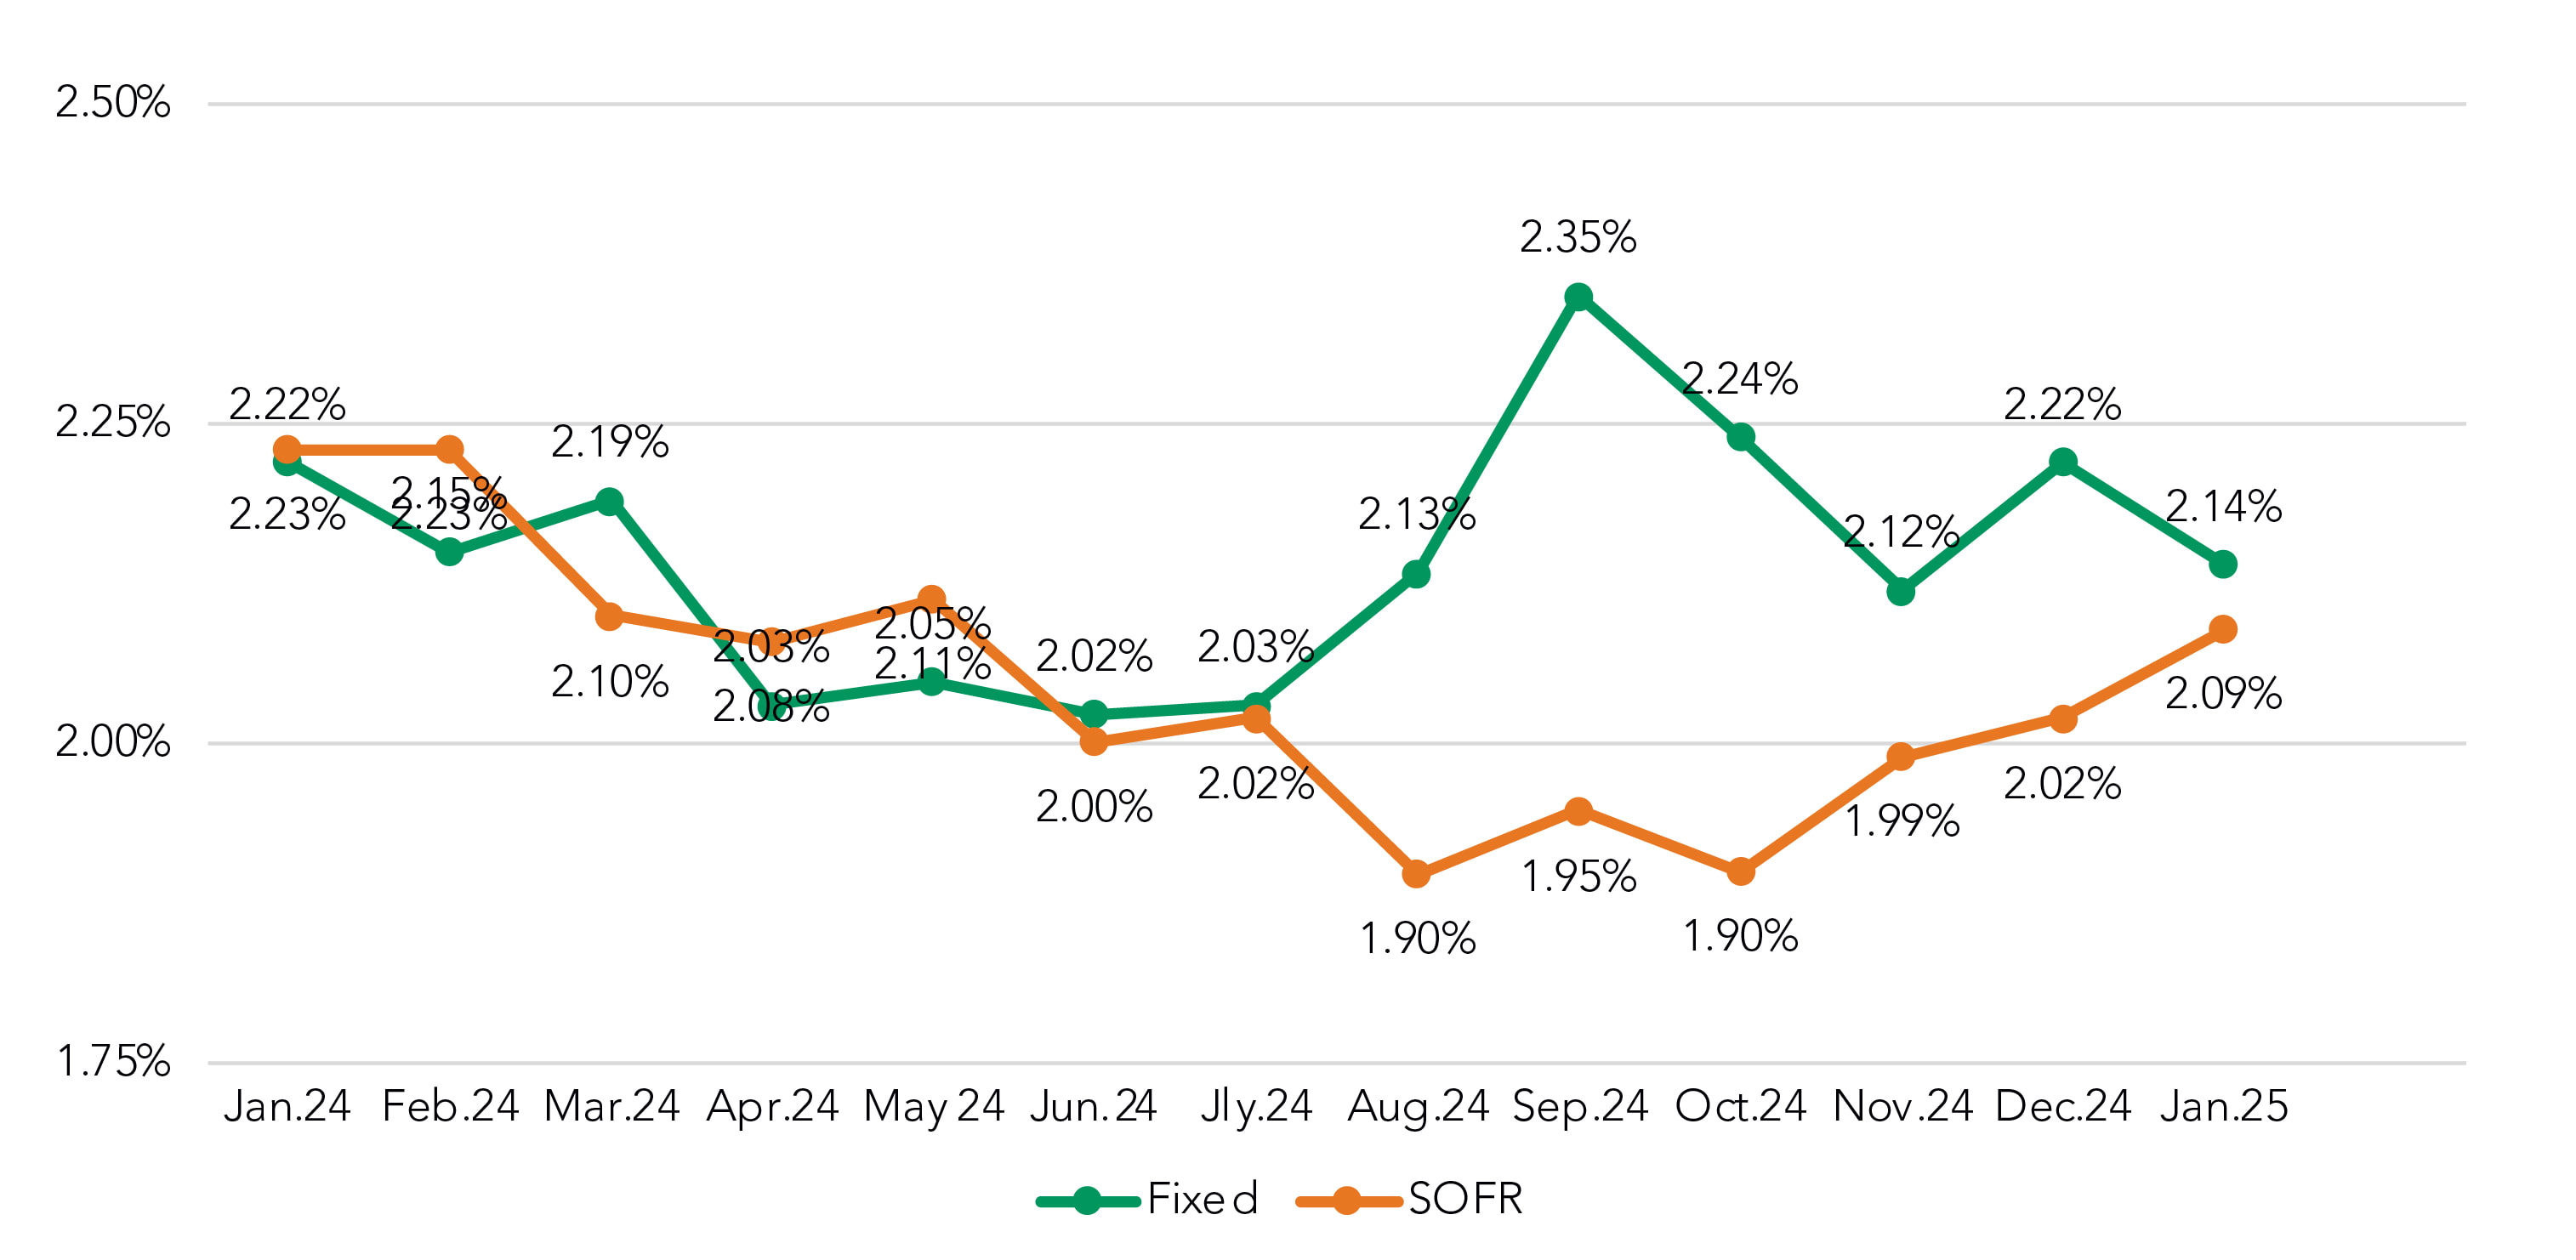
Pulling back and looking at January commercial loan pricing from a broader view, we found that the coupons for fixed-rate and SOFR-based floating loans continued to converge – a trend that began when rates were cut in Q3 2024. The gap of 160 bps in August 2024 is now down to just 10 in January.
Coupon Rate by Month
Rolling Trend
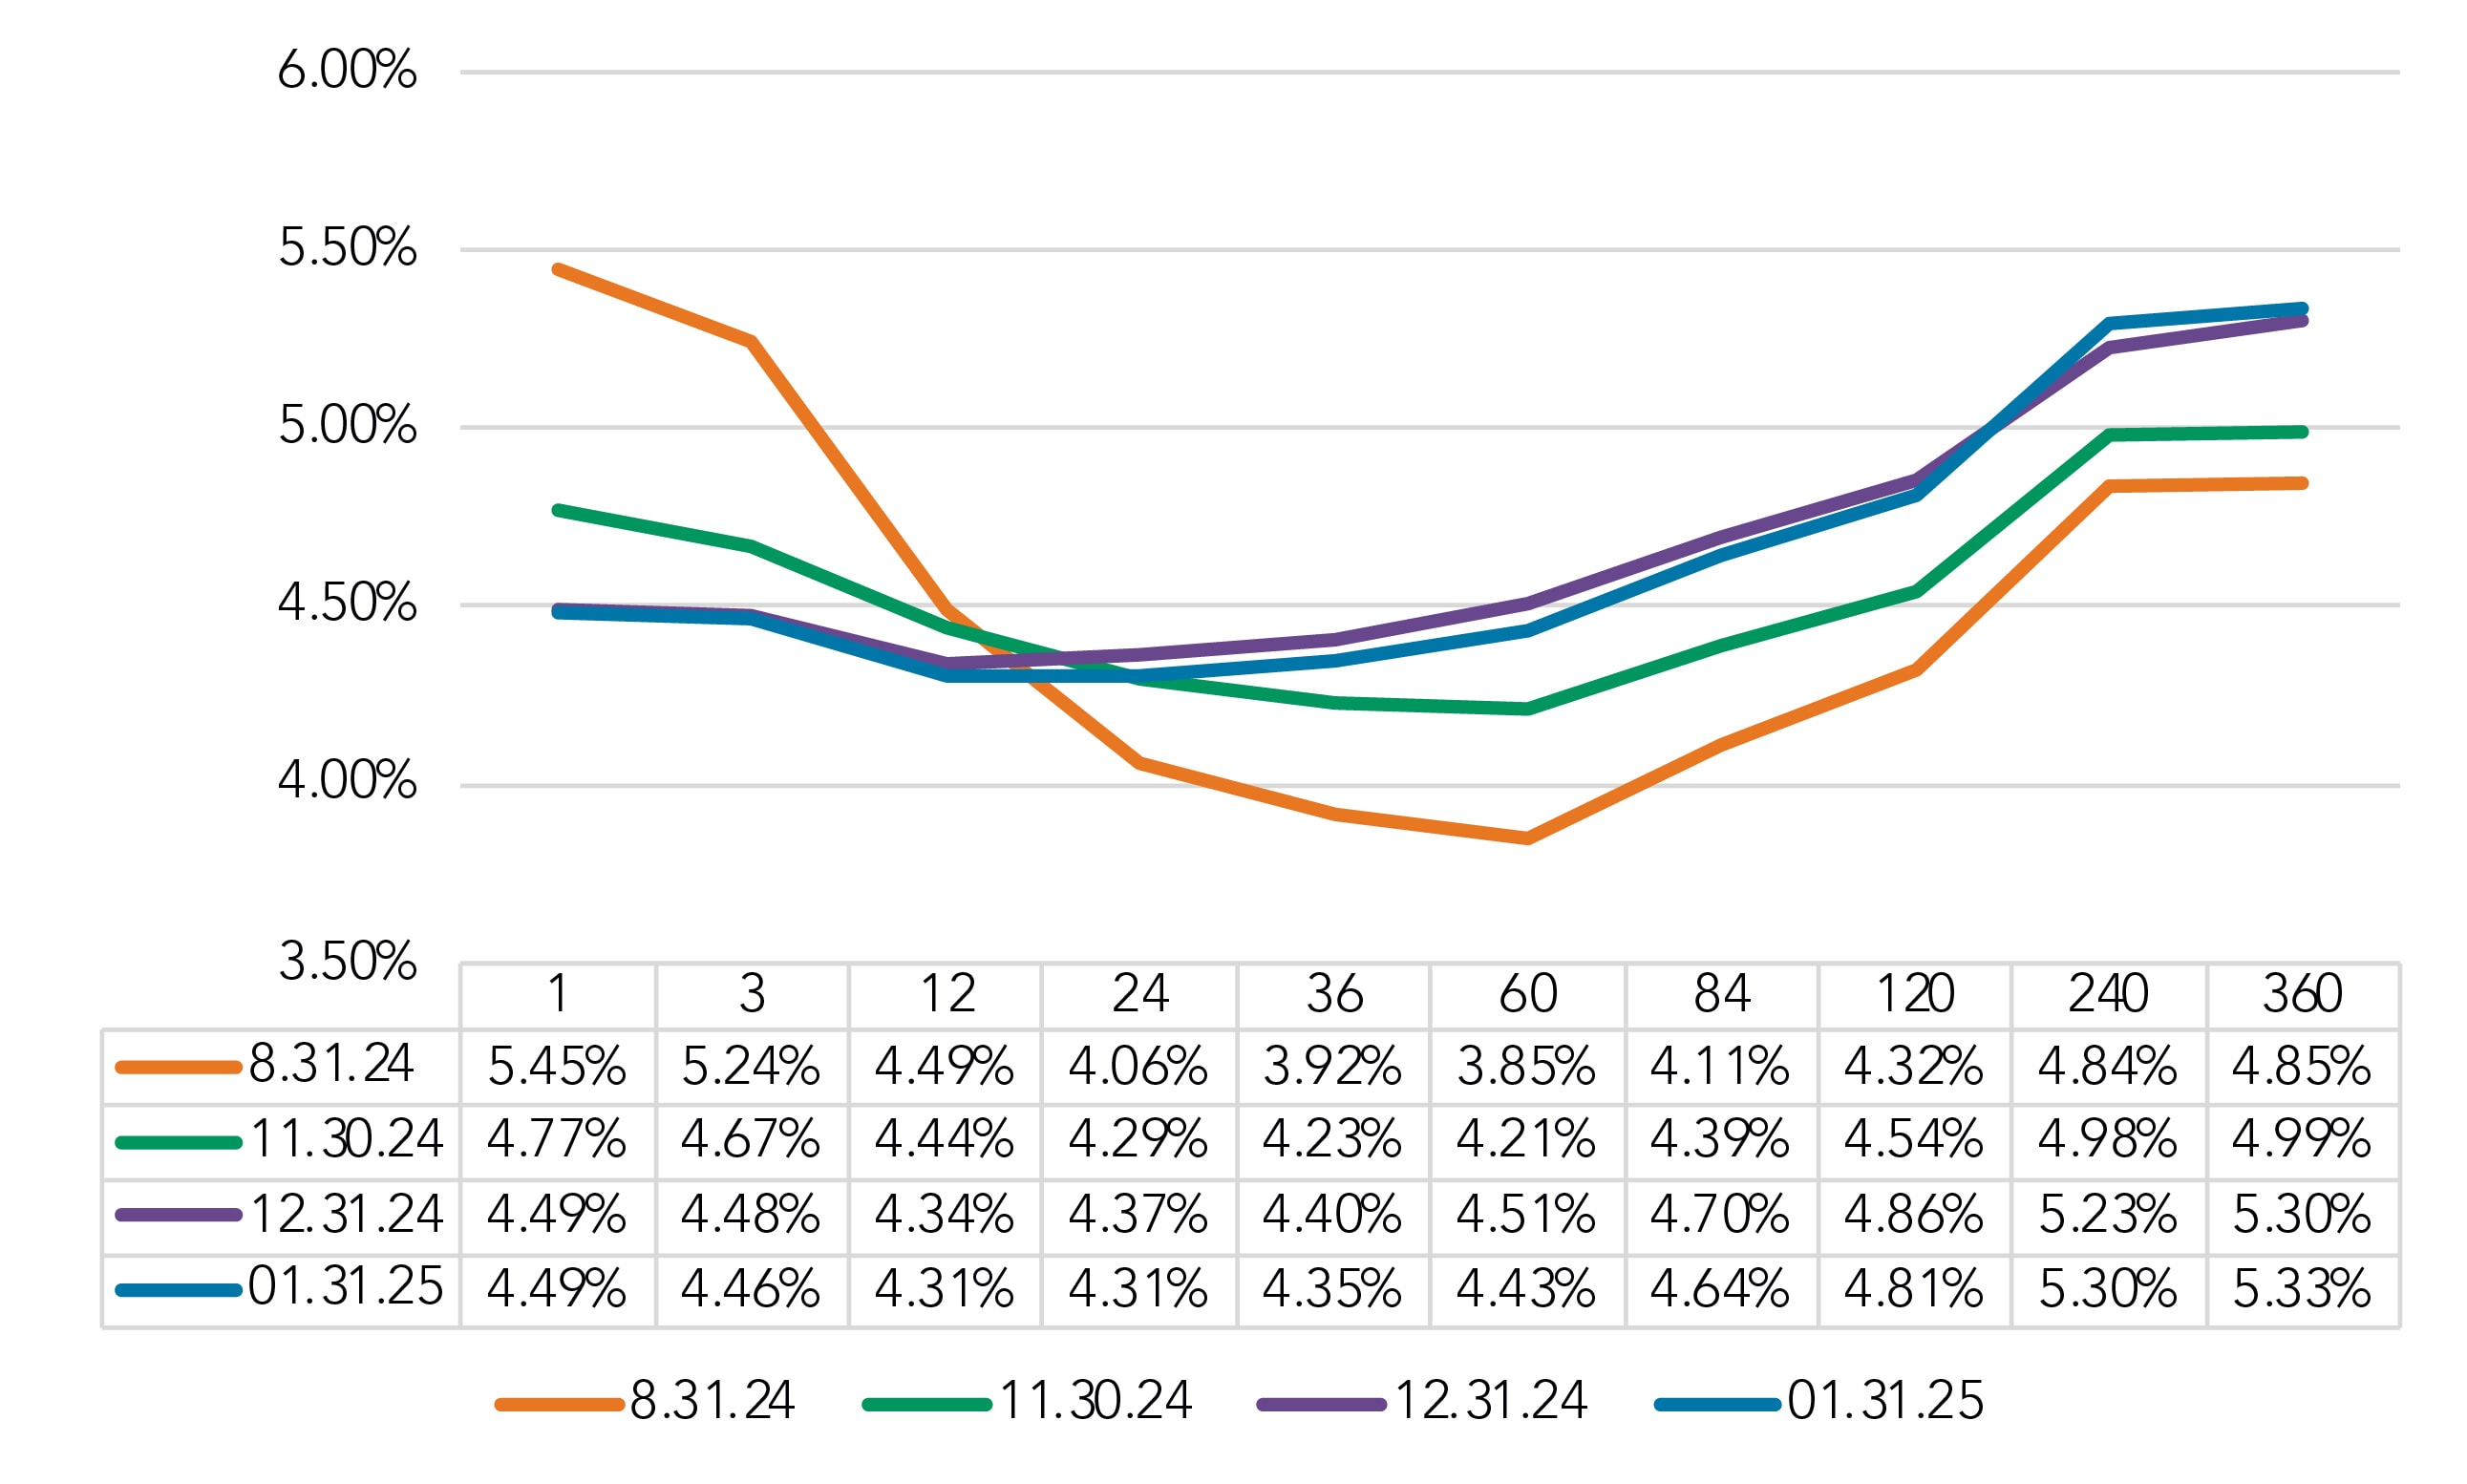
FHLB curve: 12-month maturities are an inflection point
Since our last update for November metrics, rates moved lower for maturities of less than 12 months and higher for maturities greater than 12 months. The December Fed rate cut of 25 bps drove the short-term rate change of 28 bps on the FHLB curve 1-month. For longer term maturities, the FHLB 60-month rate – a proxy for fixed-rate loans – increased by 22 bps since the Nov. 30 snapshot (4.21%) to Jan. 31 (4.43%)
The inversion, as measured from the 1-month to 60-month points, ended January at -5 bps. As of this writing, it is flat at 0 bps.
Overall, since fed rate cuts began, the curve has steepened by ~160 bps, with long rates moving up ~60 bps.
FHLB Curve
Selected Dates
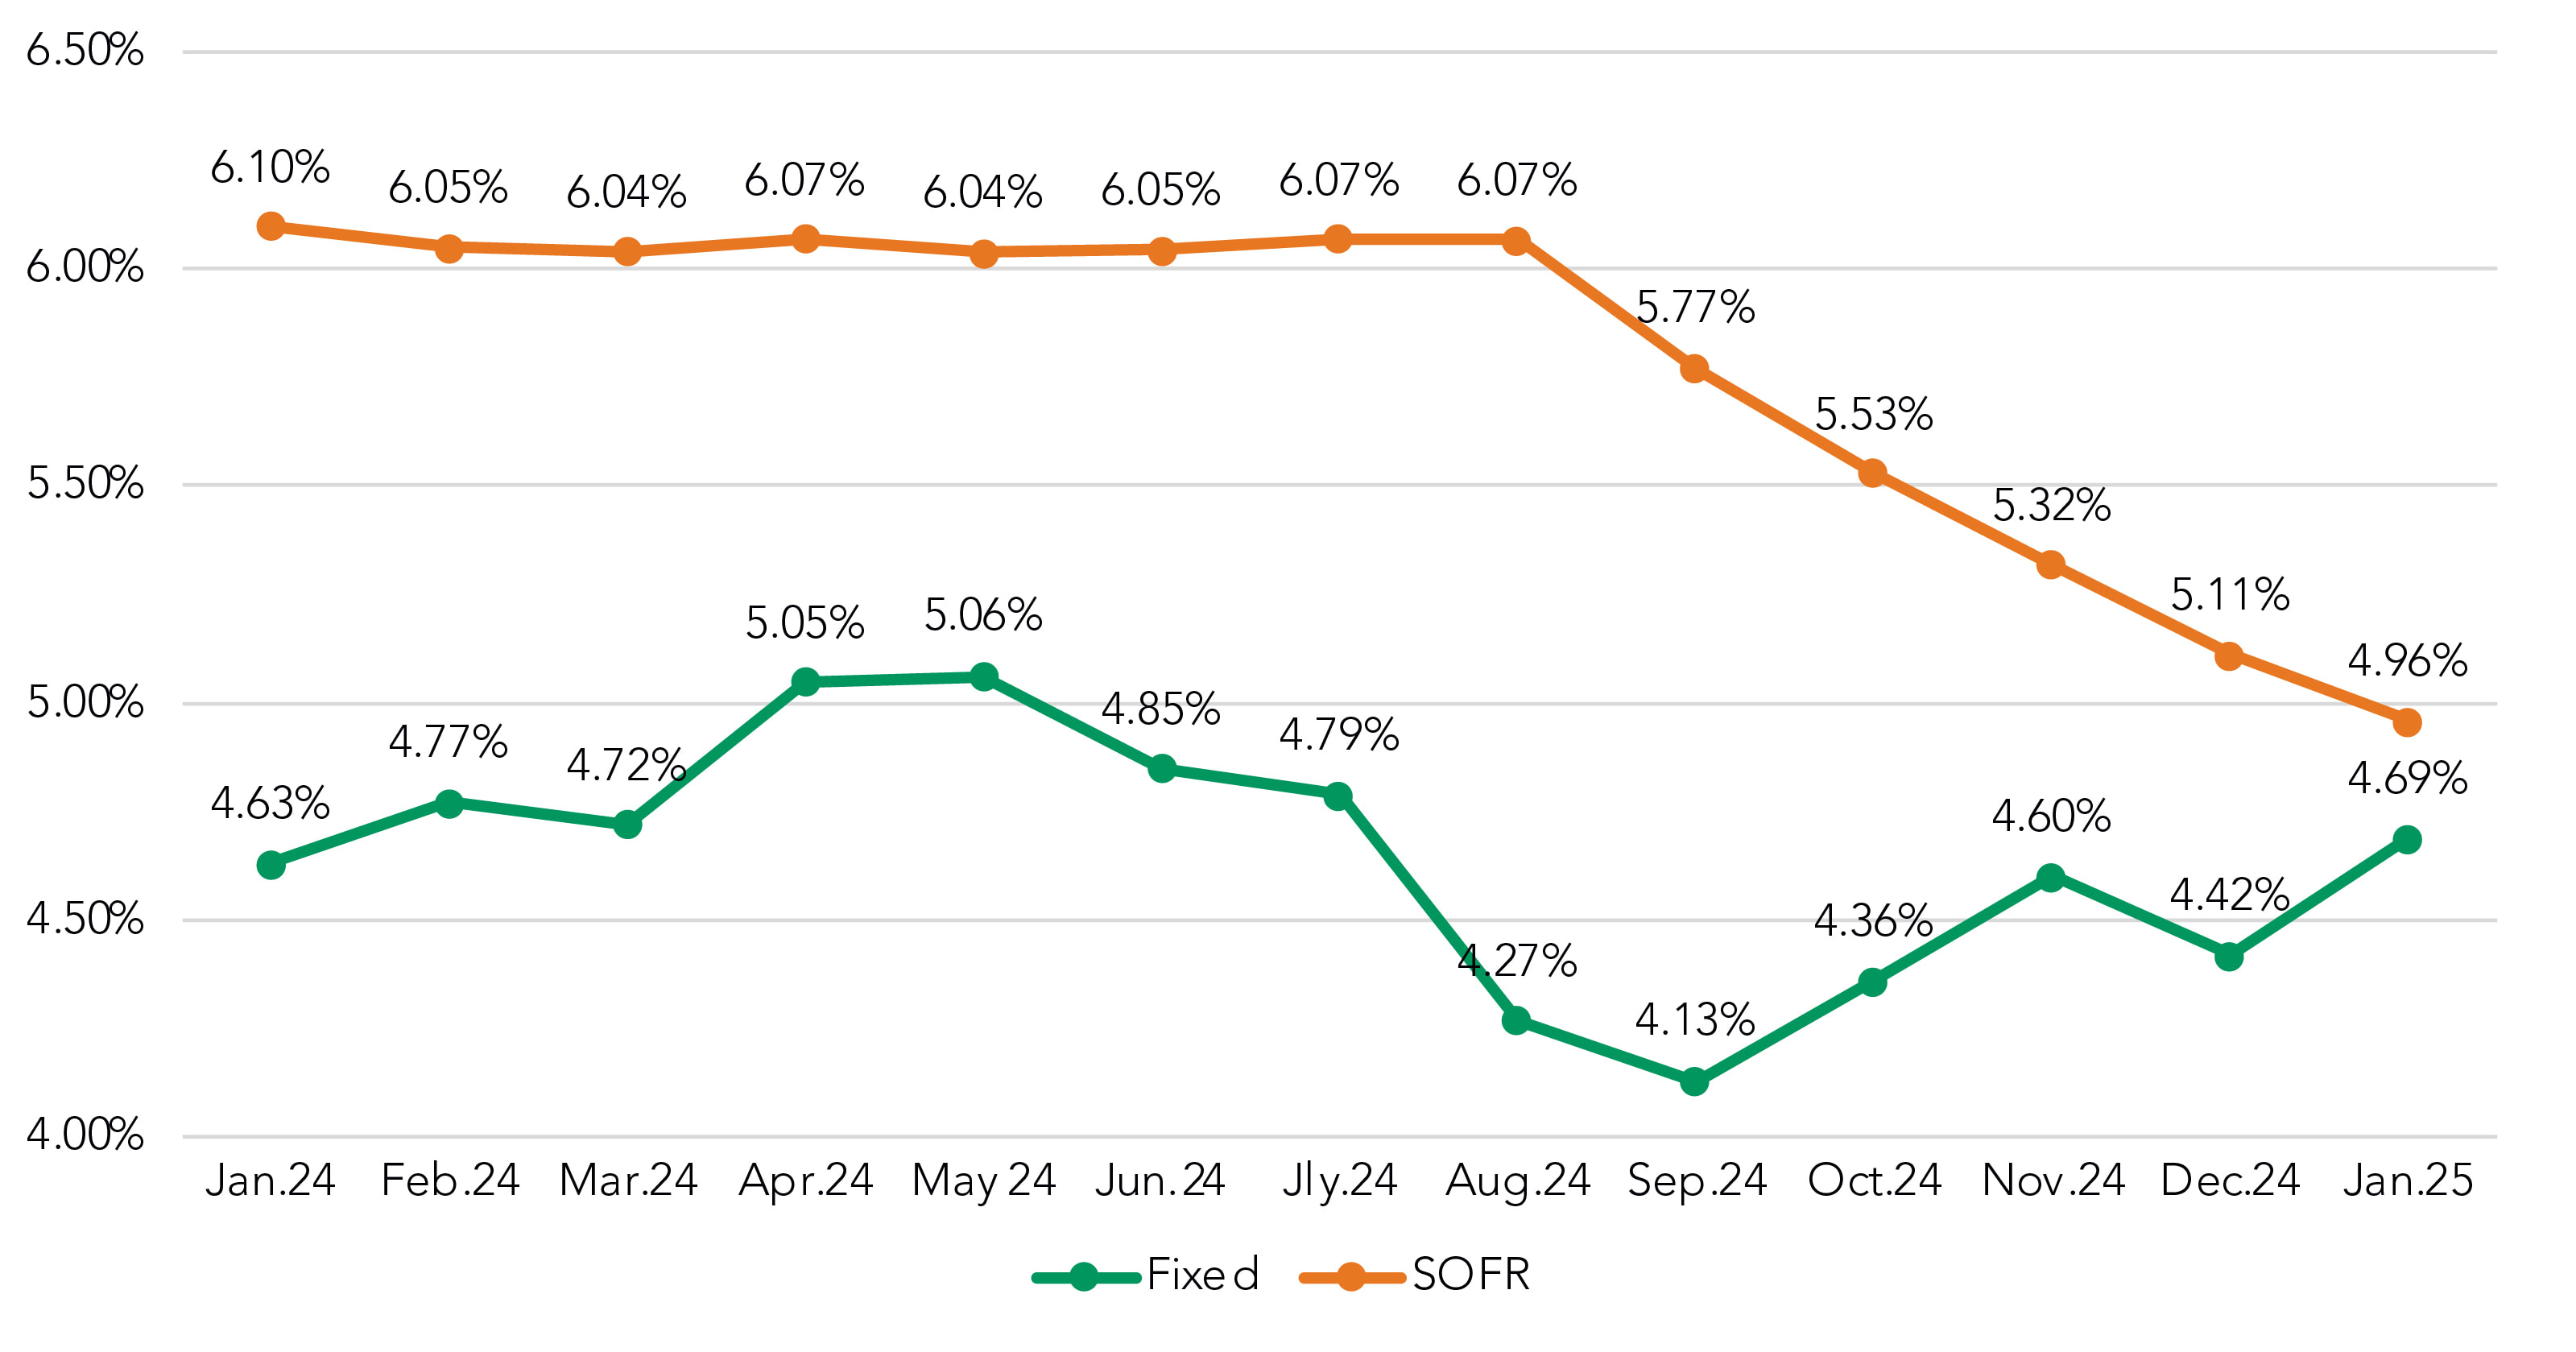
Funding costs for fixed- and SOFR structures converge
Funding costs for both SOFR-based floating loans and fixed-rate loans continue to track the FHLB curve shift away from inversion to a more traditional, “up and to the right” look.
From August 2024 through January 2025, SOFR-based funding costs have fallen 101 bps – tracking the fed rate cuts of 100 bps – and the FHLB 1-month rate movement was virtually the same, down 96 bps from the Aug. 30, 2024, snapshot to the January 2025 snapshot.
Meanwhile, from September 2024 to January 2025, fixed-rate costs climbed 56 bps (4.13 to 4.69), tracking the FHLB 60-month rate increase of 58 bps from the Aug. 30, 2024, snapshot (3.85%) to Jan. 31, 2025 (4.43%).
All-In COF by Month
Rolling Trend
Spreads fall for fixed-rate and SOFR structures
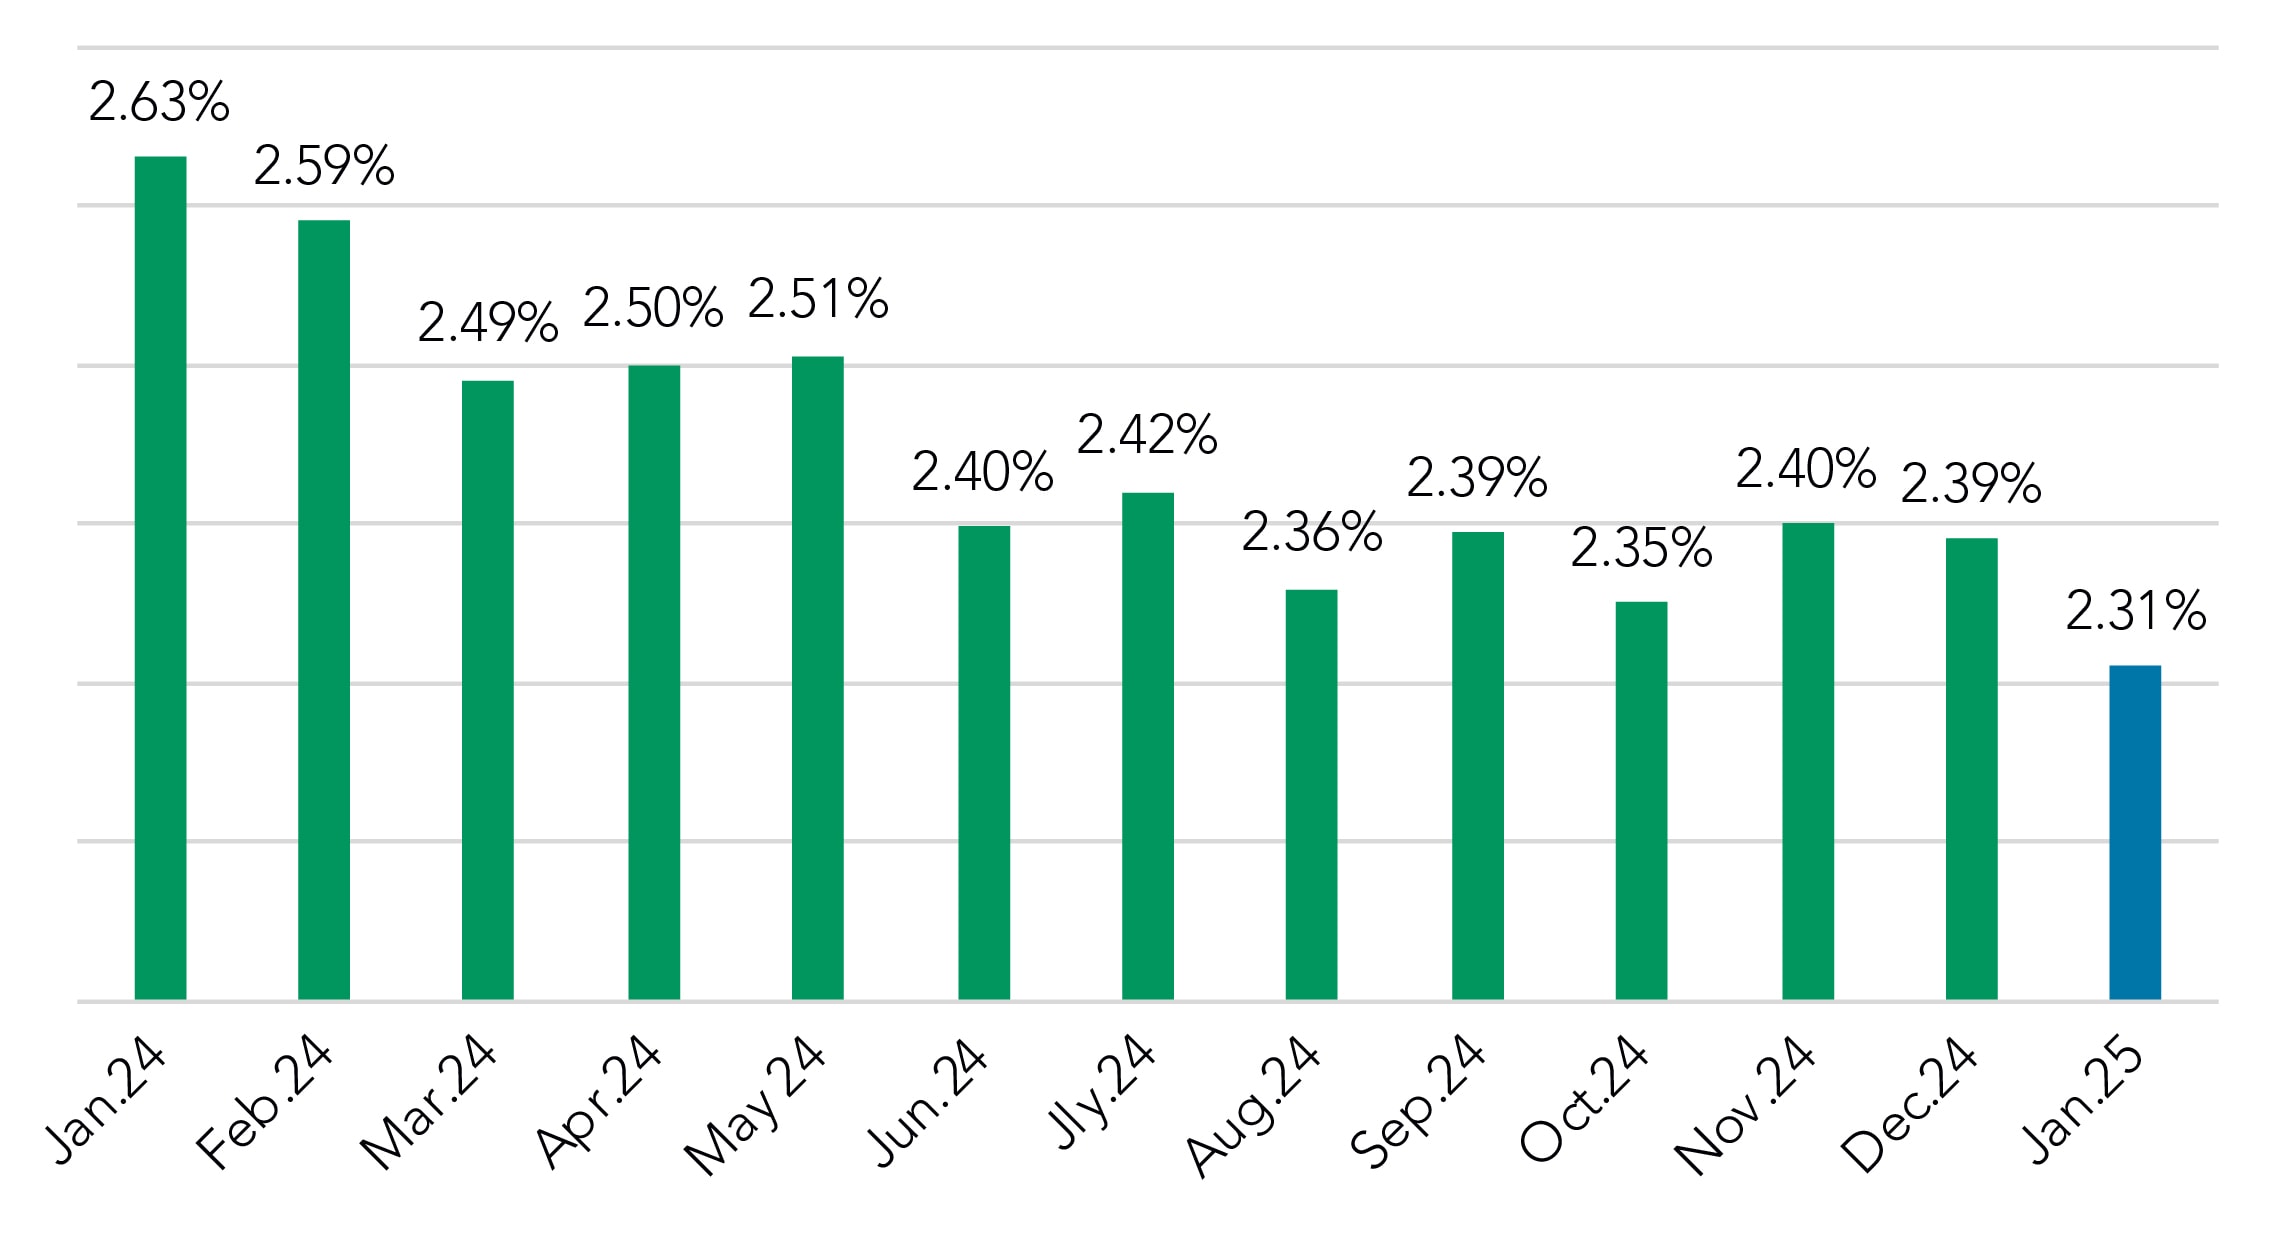
Spreads on SOFR structures dropped by 8 bps in January, down to 2.31%. That’s the lowest monthly mark since we’ve seen since we began tracking this metric in late 2021. We also note Prime spreads moved +2 bps to 19 bps at the higher end of its range over the past year.
Weighted Average Spread to SOFR
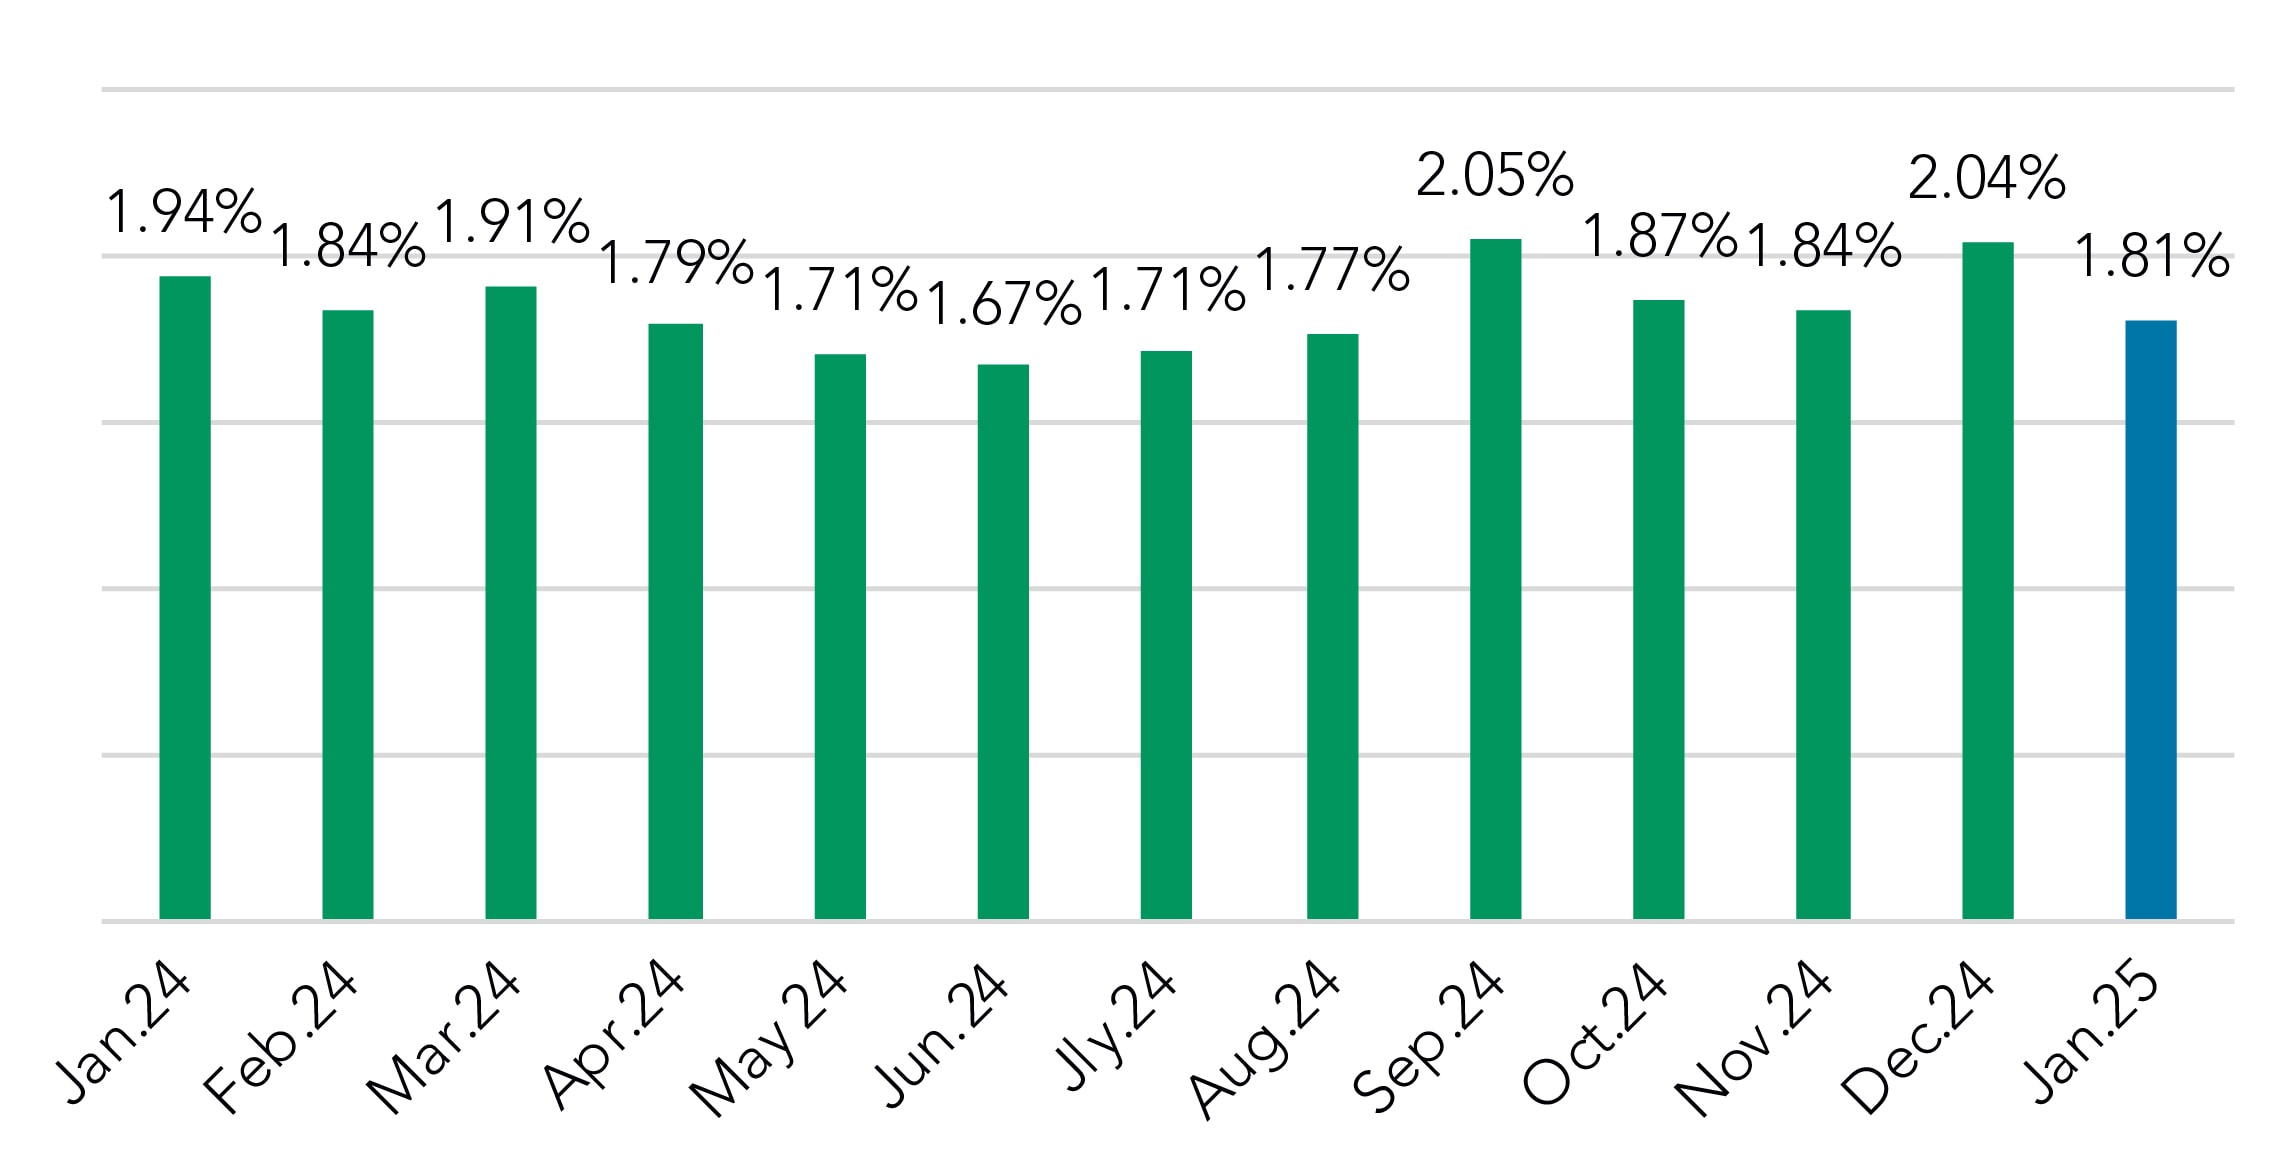
Meanwhile, fixed-rate spreads fell by 23 bps in January, down to 1.81%, the lowest mark since August 2024. Bankers do not seem to be as nimble in protecting these spreads, as evidenced by month-over-month movements of +/- 25 bps while SOFR spreads have been moving inside of 10 bps and often 5 bps.
Fixed Rate Coupon over COF
NIM mixed for fixed-rate and SOFR structures
The drop in funding costs (15 bps) for SOFR-based structures in January outpaced the spread drop (8 bps), resulting in a 7-bps increase in NIM, the third straight monthly increase.
Fixed-rate NIM fell by 8 bps, as the coupon increase could not keep pace with rising funding costs. Fixed-rate NIM has dropped 21 bps since Sep. 2024.
NIM by Month
Rolling Trend
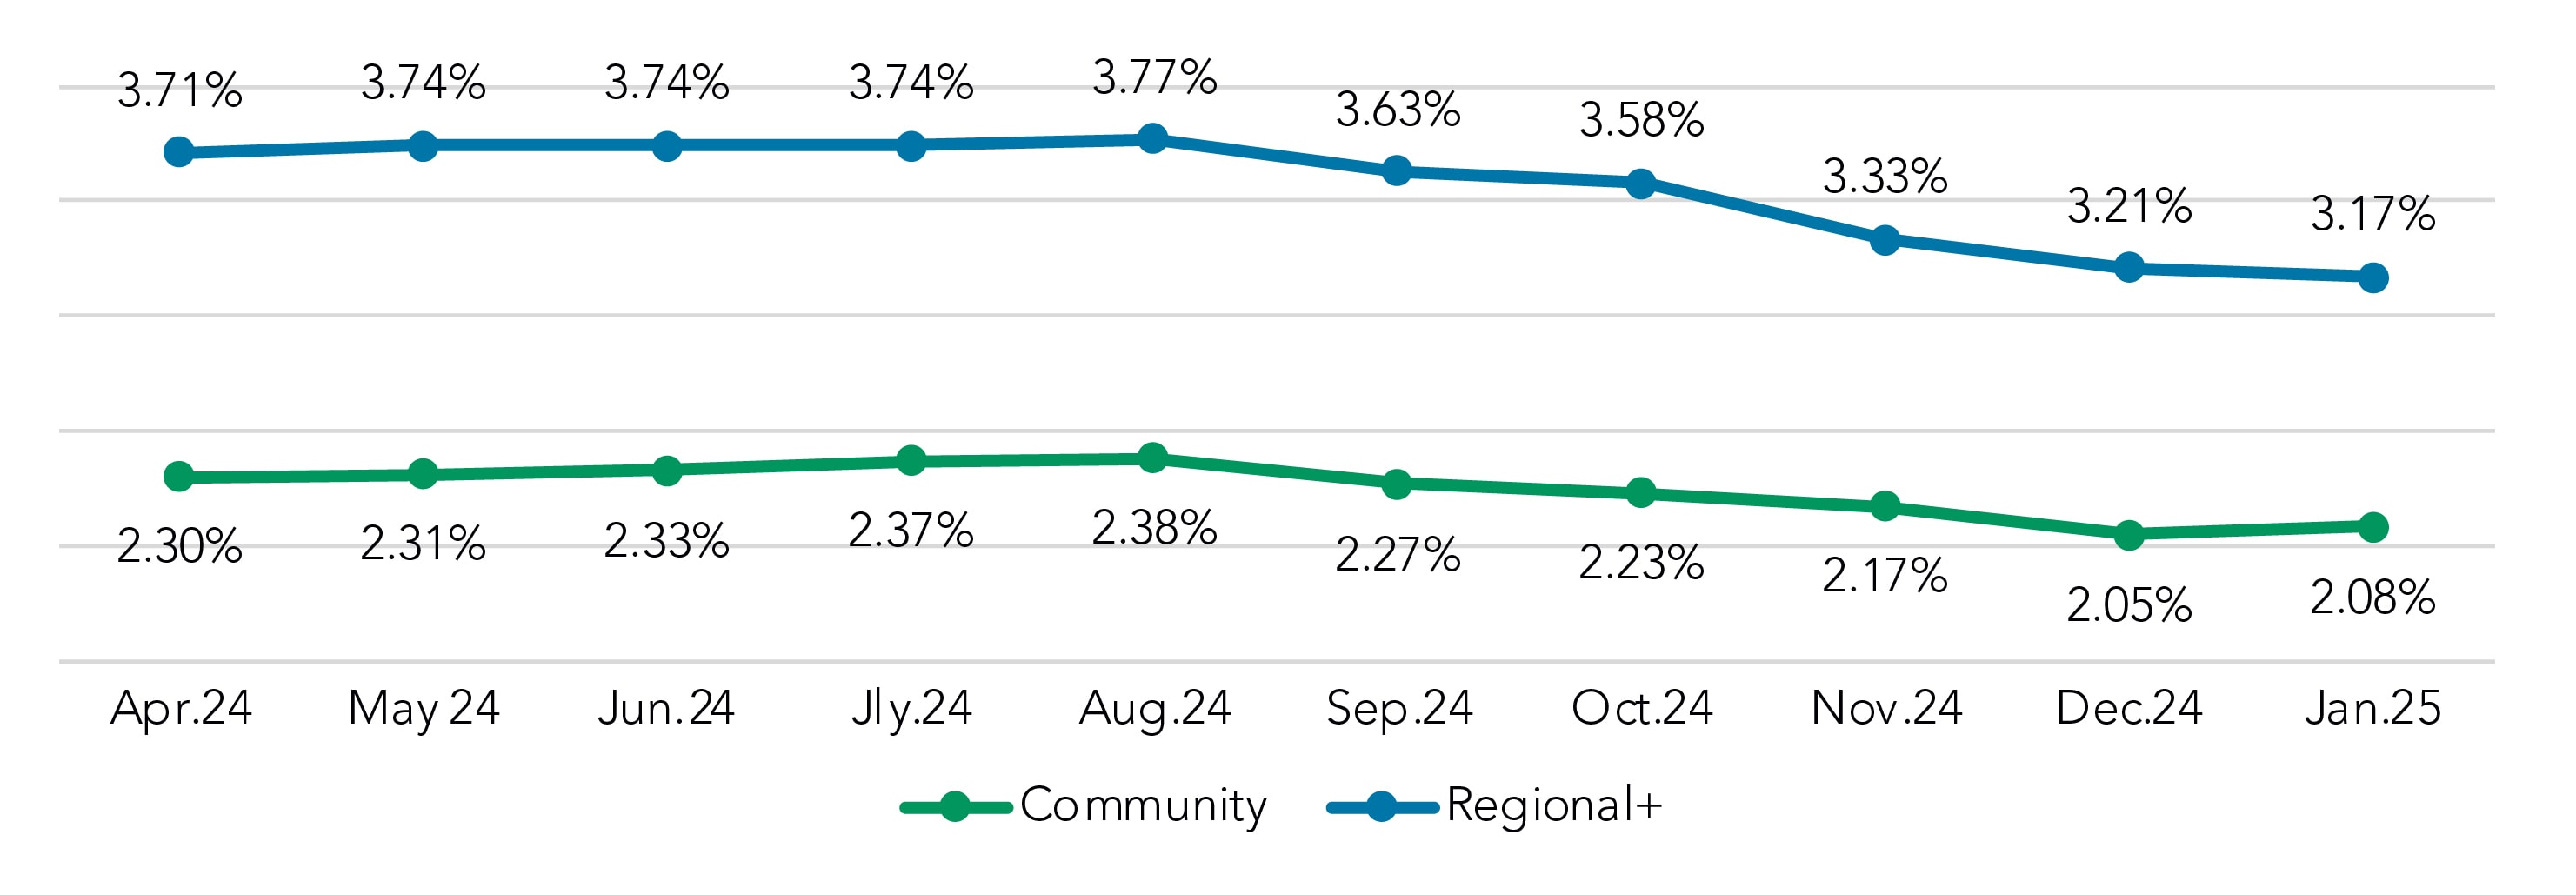
Deposit rates stay steady
Overall deposit rates remained largely unchanged in January when compared to December, but it is worthing noting that the advantage community institutions have held in interest bearing rates, both non-time and CDs, has dwindled some since August
Overall Deposit Rate Paid
Includes NIB Base
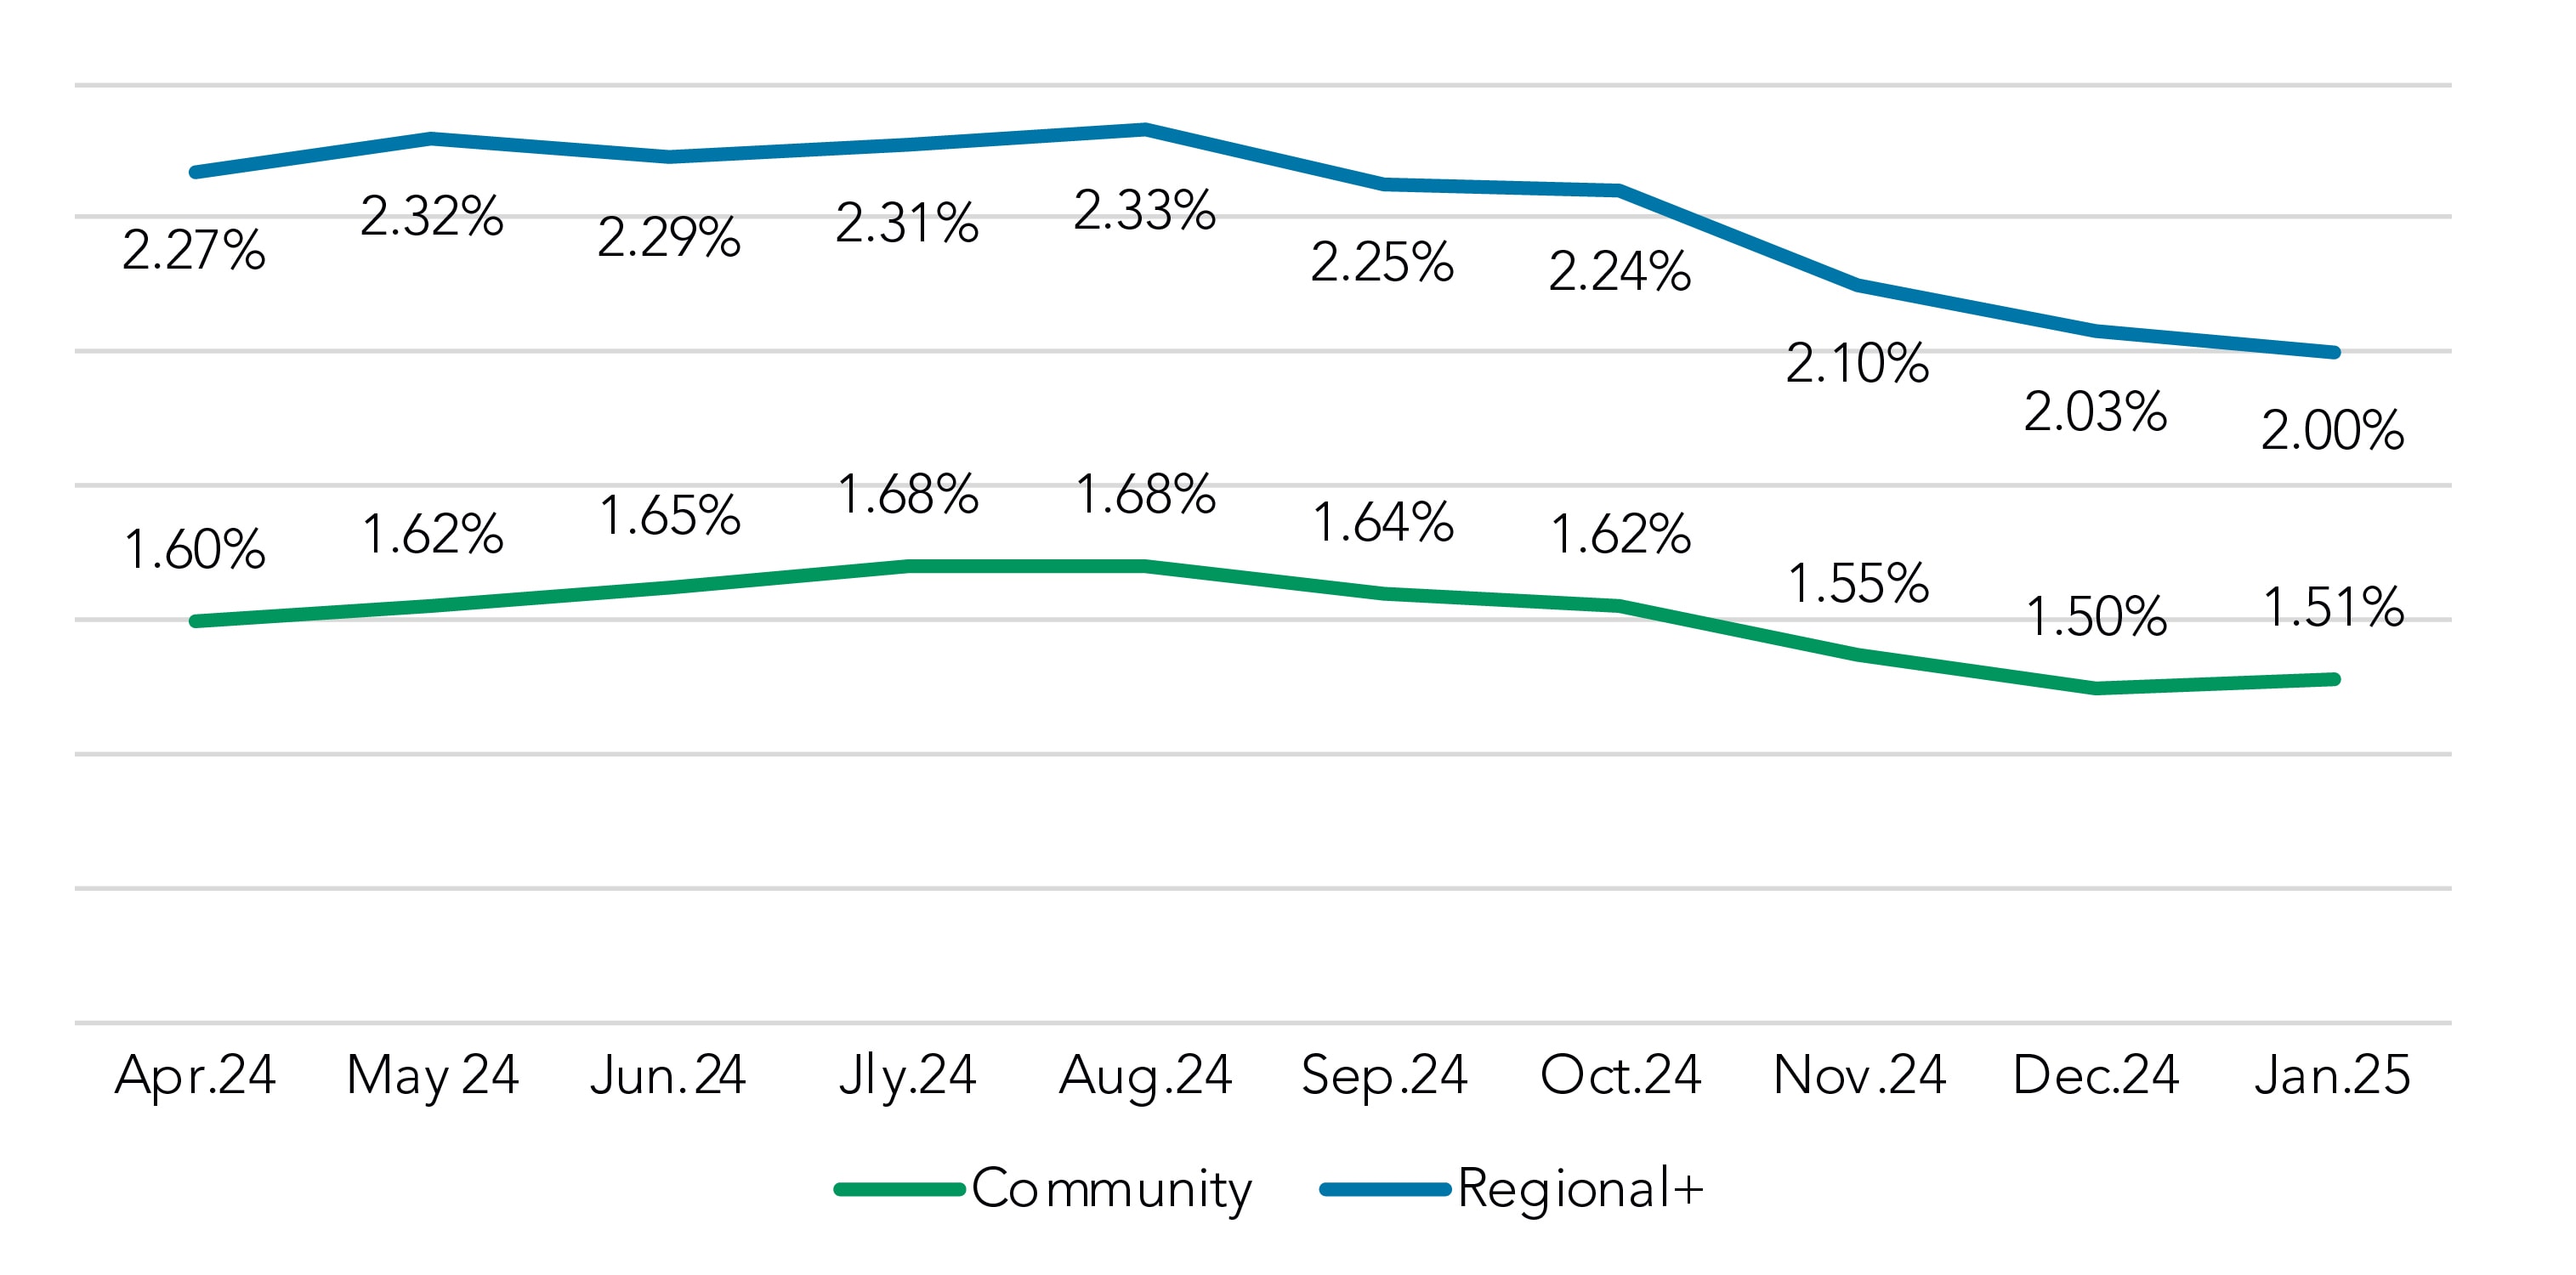
During that time, Regional+ institutions have dropped their non-time rates by 60 bps while those rates in the community segment have moved rates lower by 30 bps.
Interest Bearing Non Time (MMDA, CWI, Savings) Rate Paid
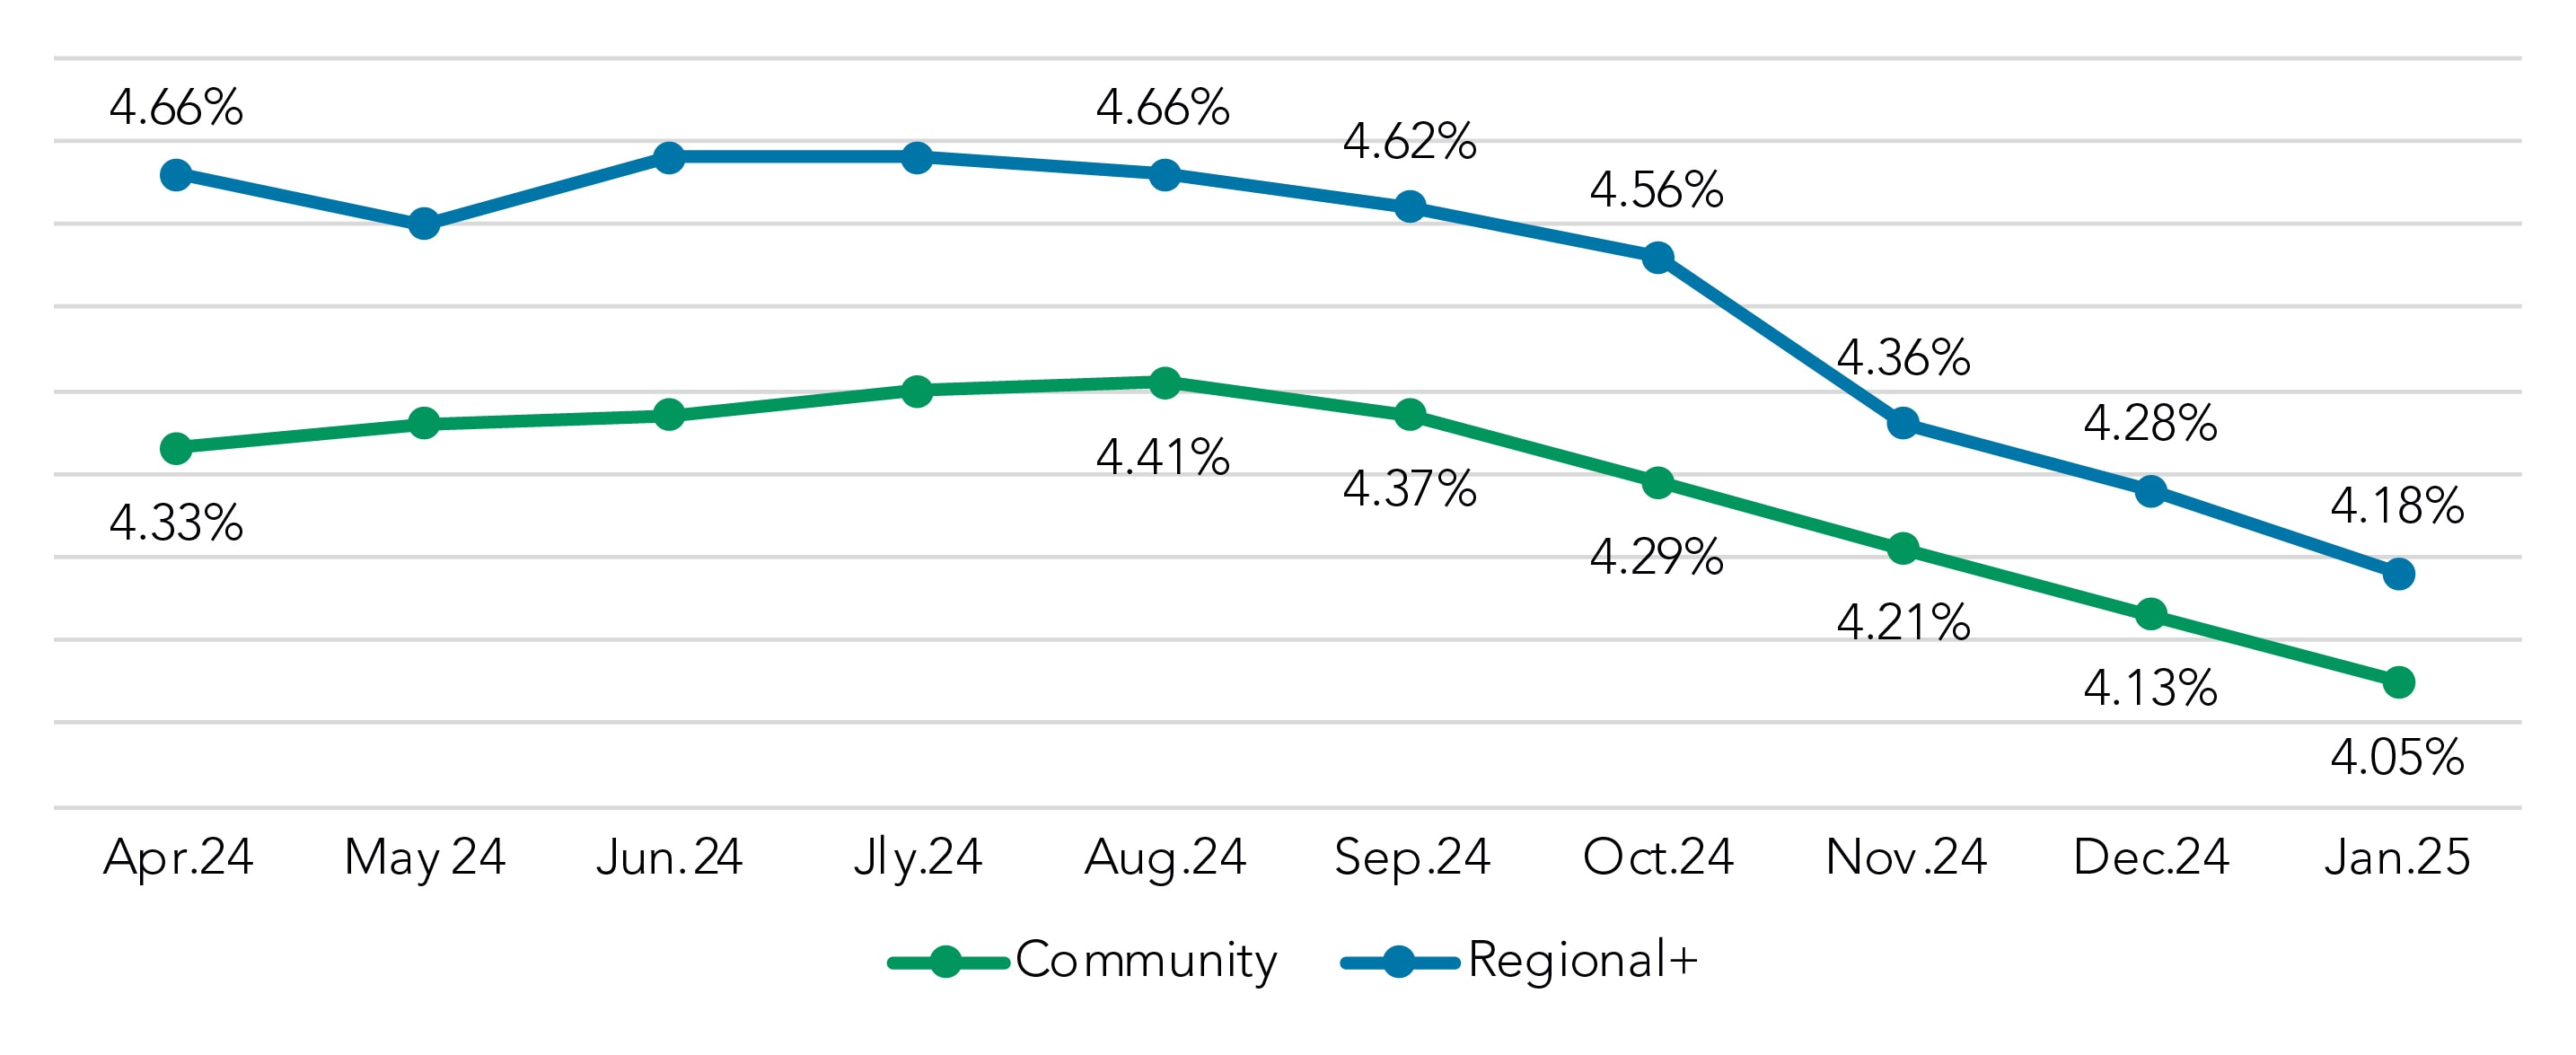
Meanwhile, CD rates have falled 48 bps at Regional+ insitutions versus 36 bps in the community segment, closing that rate gap to just 13 bps.
CD Portfolio Rate Paid
Note: Deposit rate paid information is from portfolio snapshots sent from institutions throughout the month and is not a single month-end view.
Got questions?
Our banking consultants and data scientists are combing through Q2 PrecisionLender pricing data every day. If there is anything you’d like to know about what they’re seeing, please send your questions to insights@q2.com.