Commercial Loan and Deposit Pricing Market Update: July 2024
Reminder: This market update is based on the previous month’s (June 2024) data in the Q2 PrecisionLender database.
In this month’s update, we continue to look at deal selectivity. Are bankers’ claims about being more disciplined about the deals they add to their books actually proven out by what we see when we examine Q2 PrecisionLender commercial loan and deposit pricing database?
The signals from the June commercial pricing data – particularly around spreads - don’t appear to support claims of selectivity at this time. But this is a story in progress, and we will continue to look at additional data points in the coming months that could support more firm conclusions.
Read on to get more details.
Note for those new to these updates: PrecisionLender uses an assumed marginal duration matched funding cost, not the bank’s actual average cost of funds, when referring to the Cost of Funds (COF) on loan pricing activity.
Pricing volume has first month-over-month drop of 2024
Before diving into the volume numbers, we wanted to first note that we’ve shifted the starting point forward from July 2023 to January 2024. We make this switch because we now have six month’s worth of data points and also to normalize for new Q2 PrecisionLender clients that have joined the database in recent months.
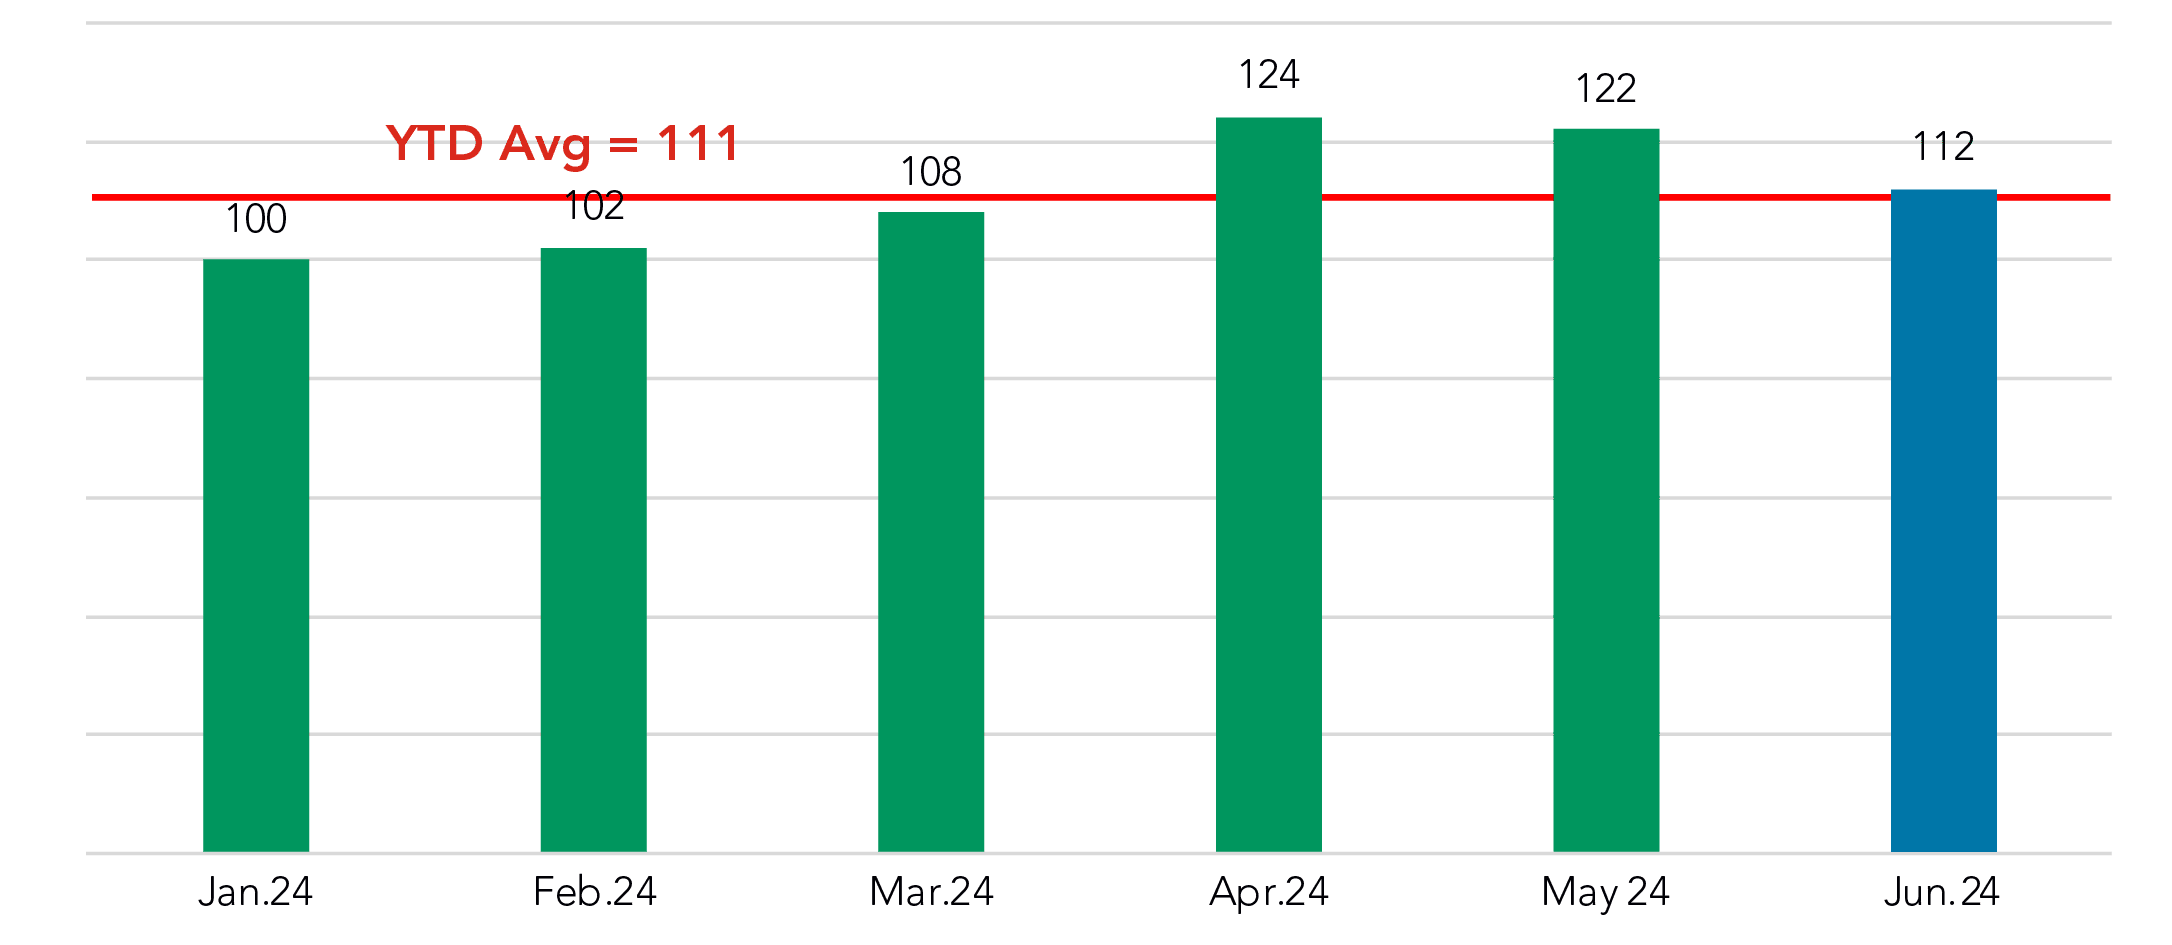
For the first time in 2024, pricing volume fell month-over-month. This drop was observed across asset-size segments as well. So, a potential check on the “More Selective” side of the ledger.
However, it’s worth noting that the June pricing volume was still above early 2024 levels.
Priced Commercial Loan Volume in $
Indexed to January 2024 = 100
Spreads drop across the board
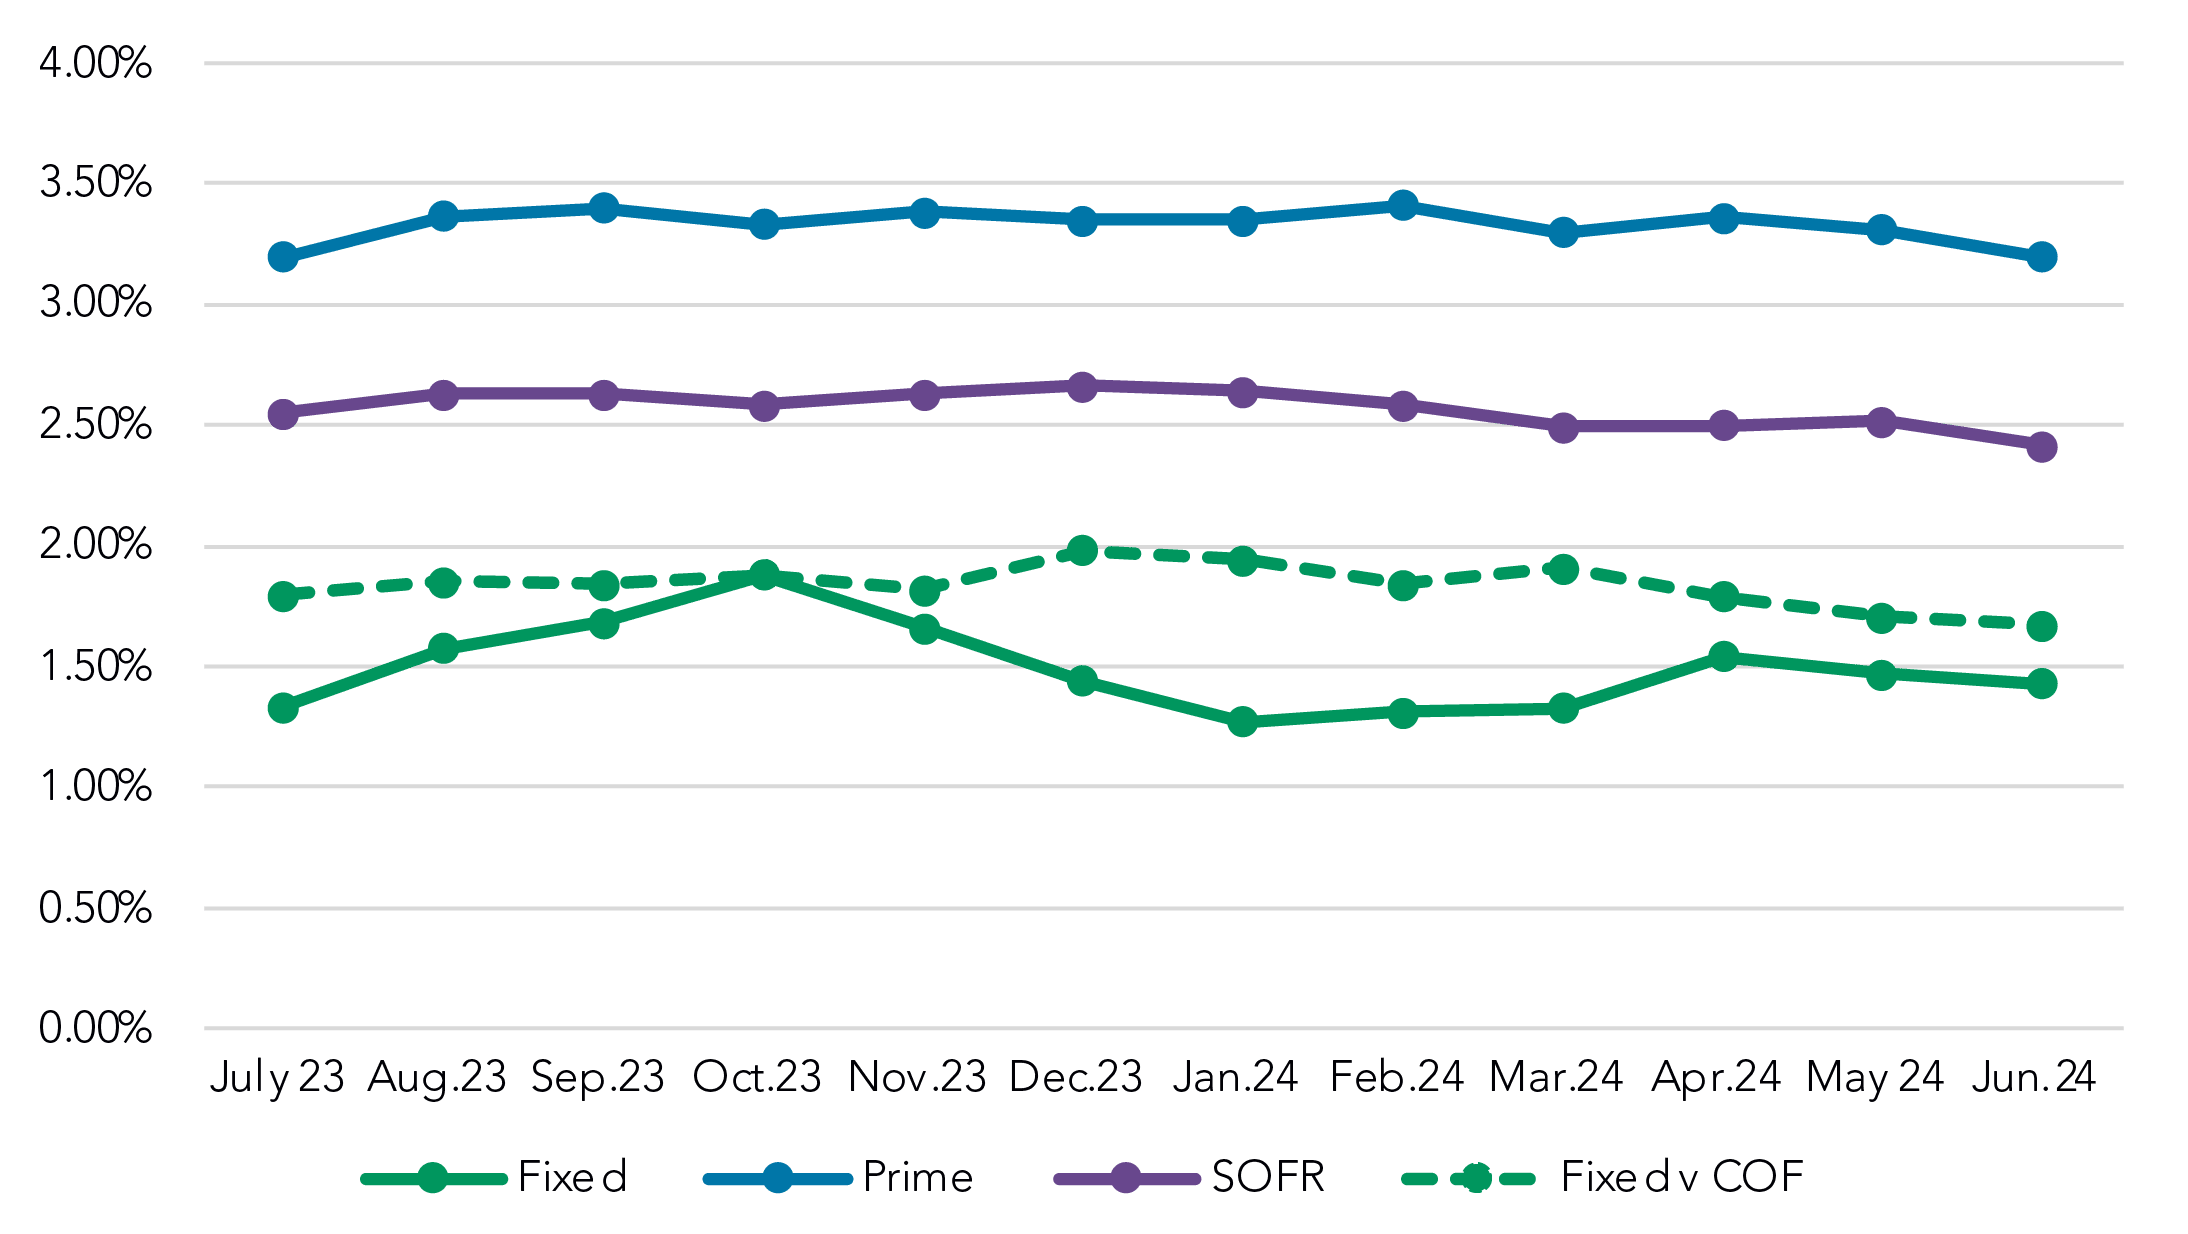
A look at SOFR equivalent spreads by structure type puts a clear checkmark on the “Not Selective” side of the ledger, as spreads fell for each structure type. SOFR and Prime dropped about 10 bps each, to 2.41% and 3.20%, respectively.
SOFR Equivalent Spread by Structure Type
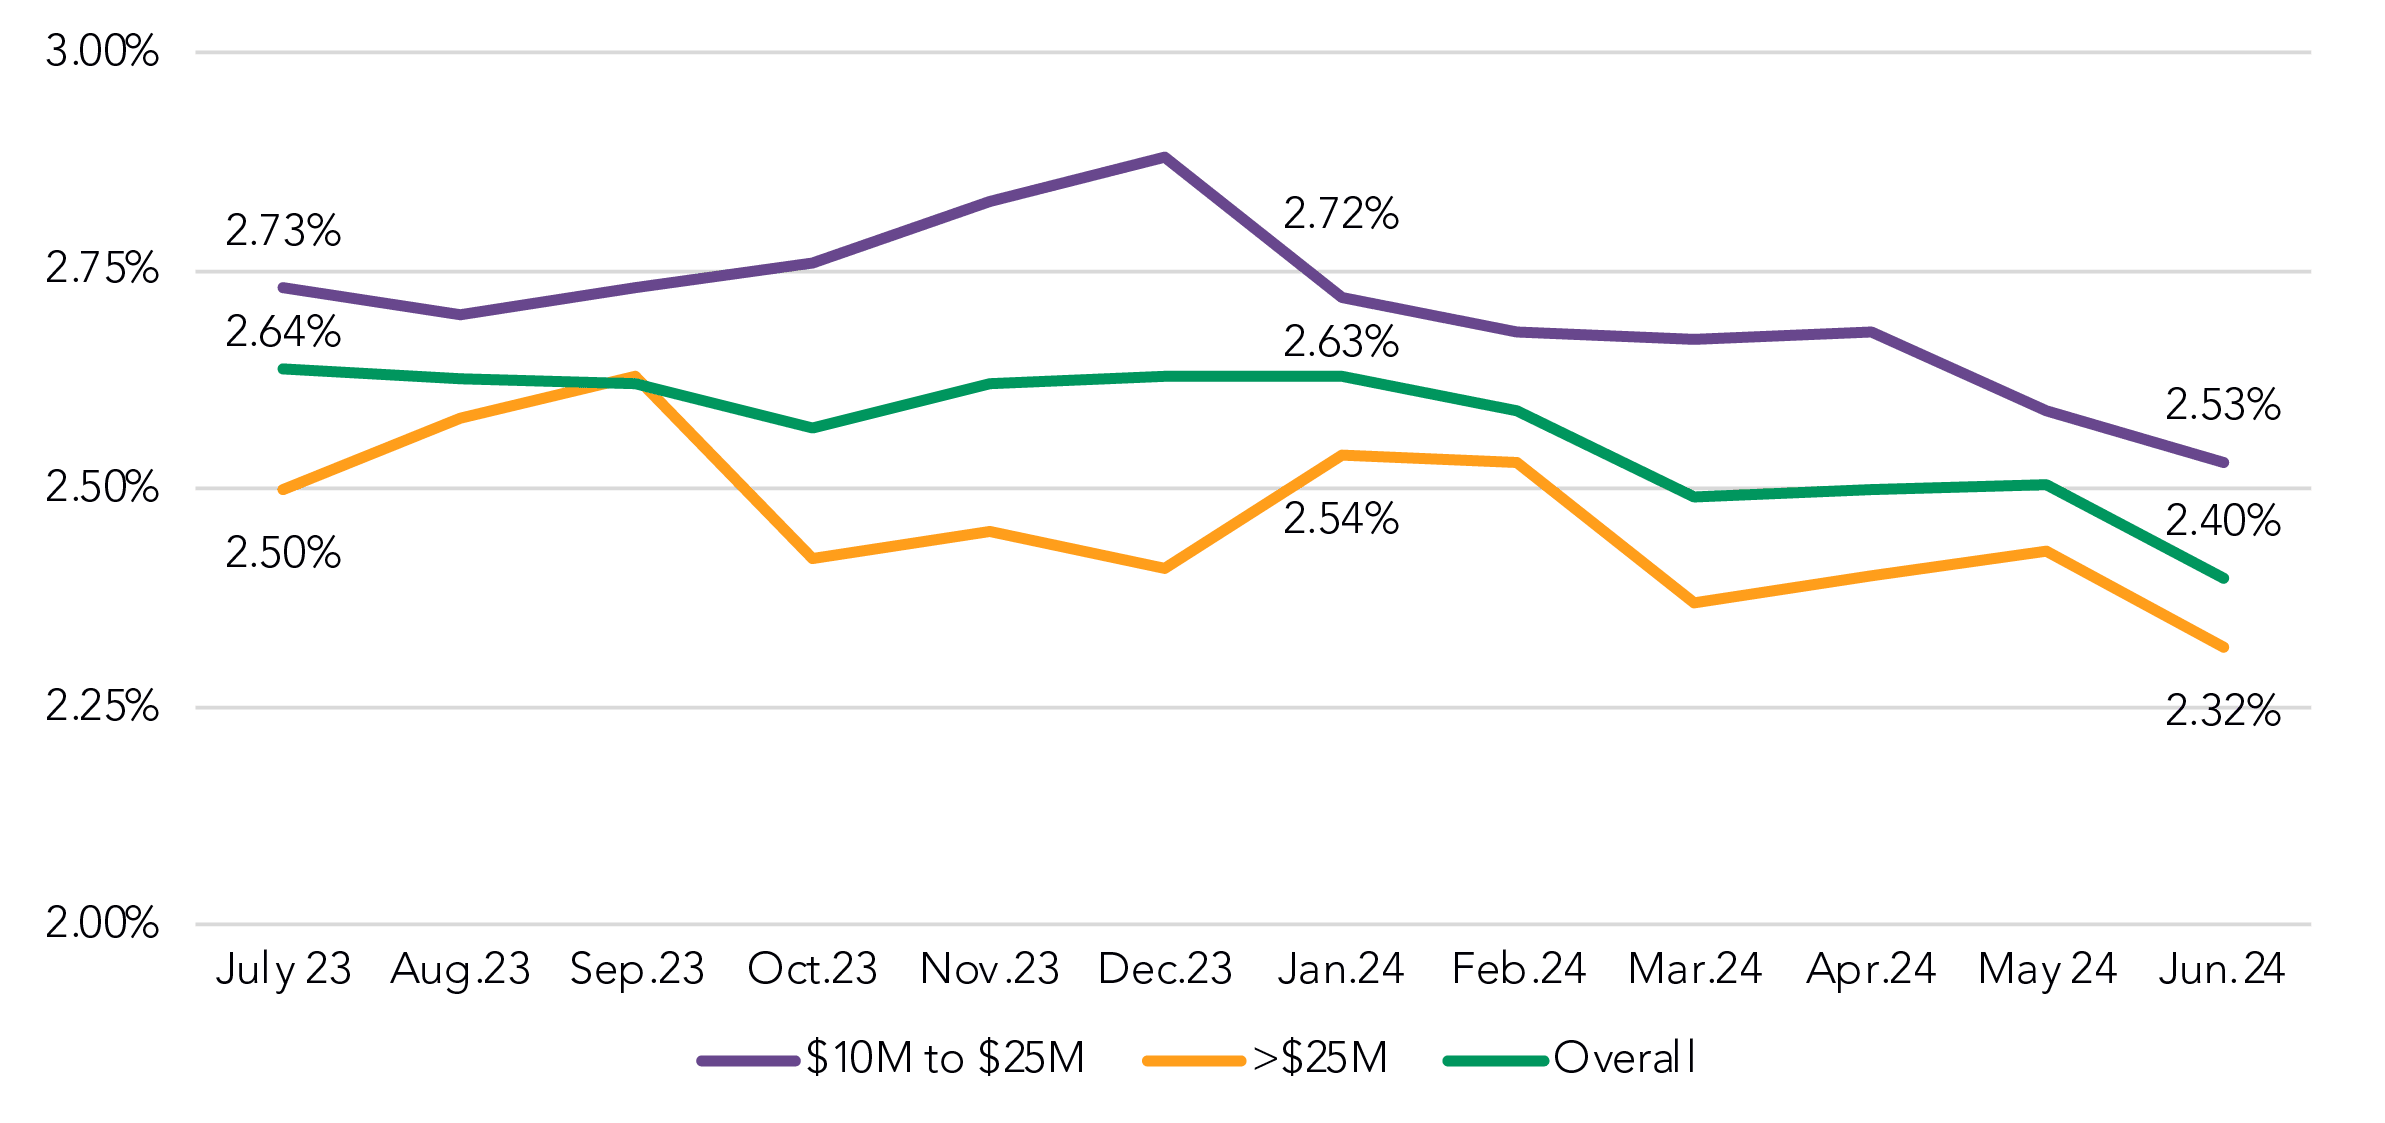
We also drilled deeper into SOFR floating rate spreads and found that deals priced in the $10-25M (-6 bps to 2.53%) and the >$25M (-11 bps to 2.32%) tranches both contributed the drop in this structure type.
Spread to SOFR on Floating Rate Loans
By commitment amount
Spreads drop despite consistent COF
Looking closer at the floating rate structures, we noted that SOFR spreads are down 23 bps since January, while Prime spreads are down 15 bps.
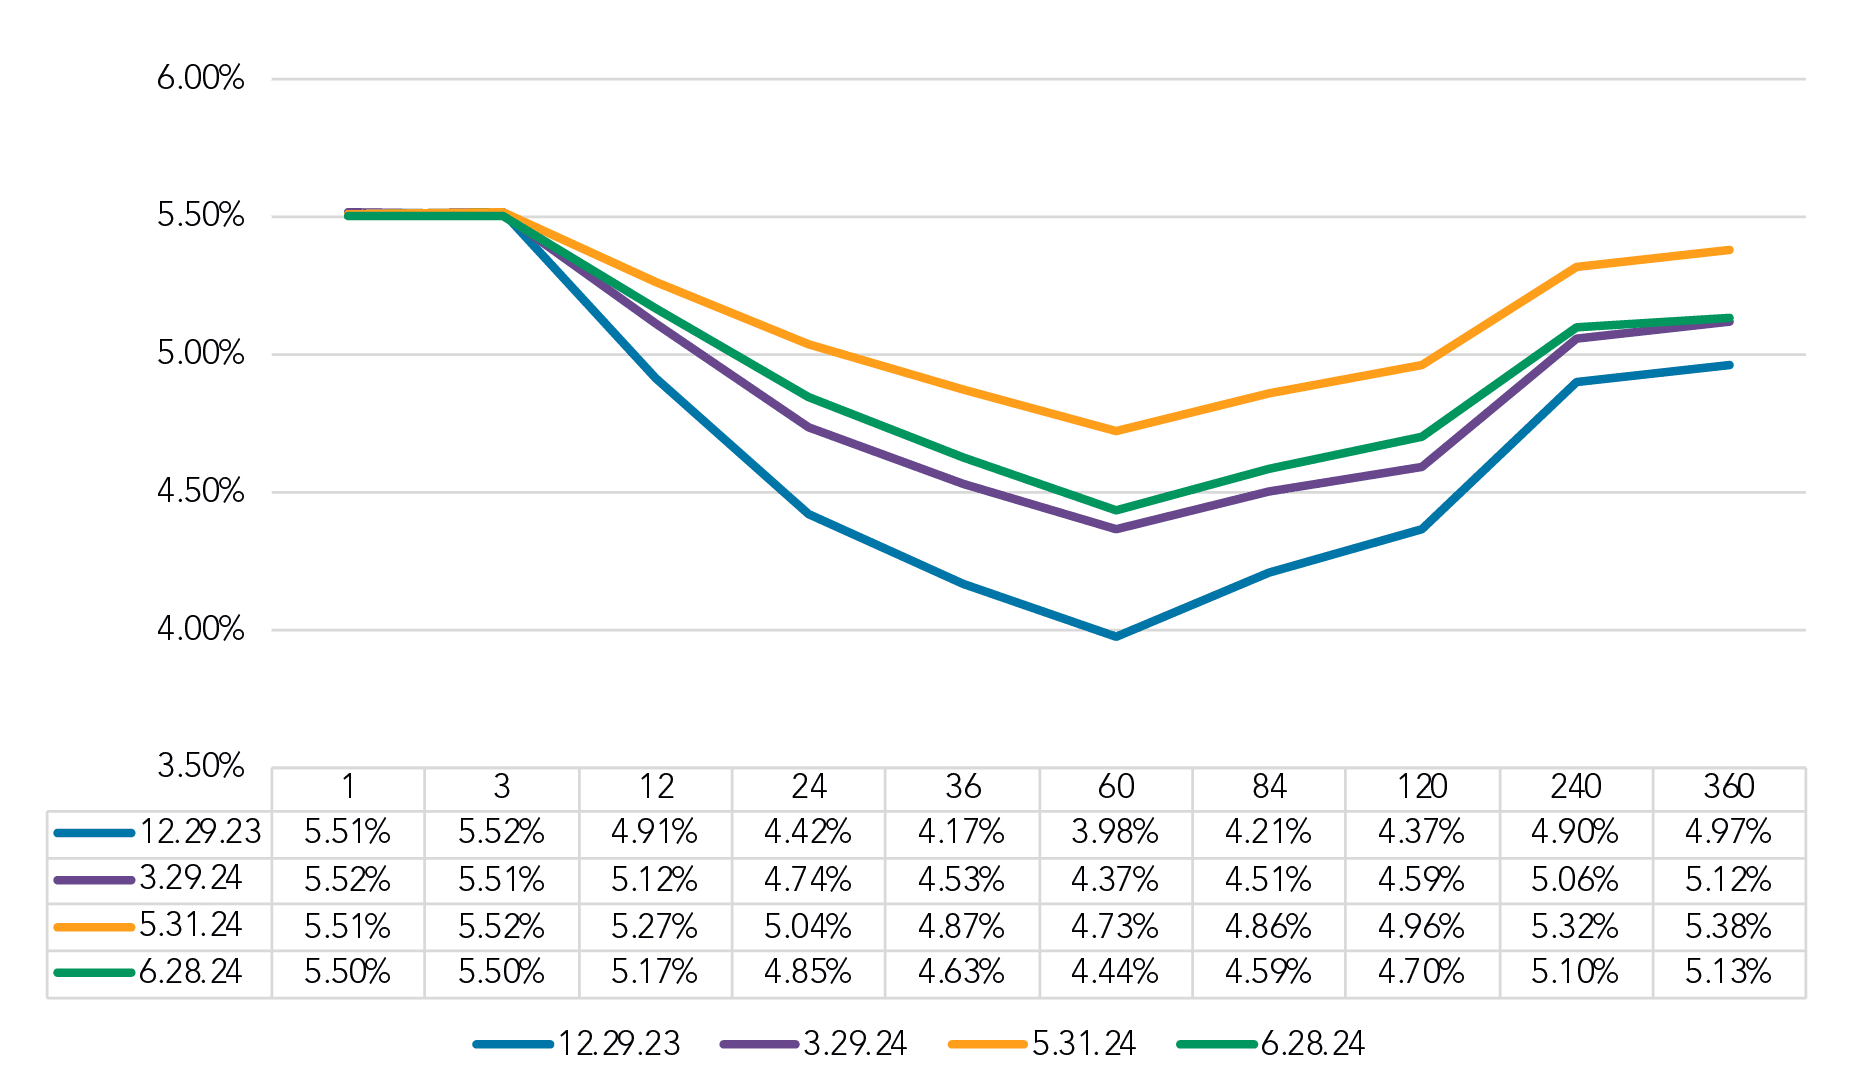
As the FHLB curve chart below shows, that spread drop can’t be attributed to funding costs – as the one-month point on the curve has been virtually unchanged in 2024.
For fixed-rate loans, funding costs are little changed for 2Q24, when looking at the 60-month rate on March 29 (4.37%) and then on June 28 (4.44%). A large drop of 29 bps from May 31 (4.73%) to June 28 gave bankers an opportunity to maintain or improve spreads, instead spreads decreased about 4 bps, month over month.
That may mean that the drop in pricing volume we noted earlier reflects not only increased banker selectivity but also a drop in loan demand in the market.
FHLB Curve
Selected Dates
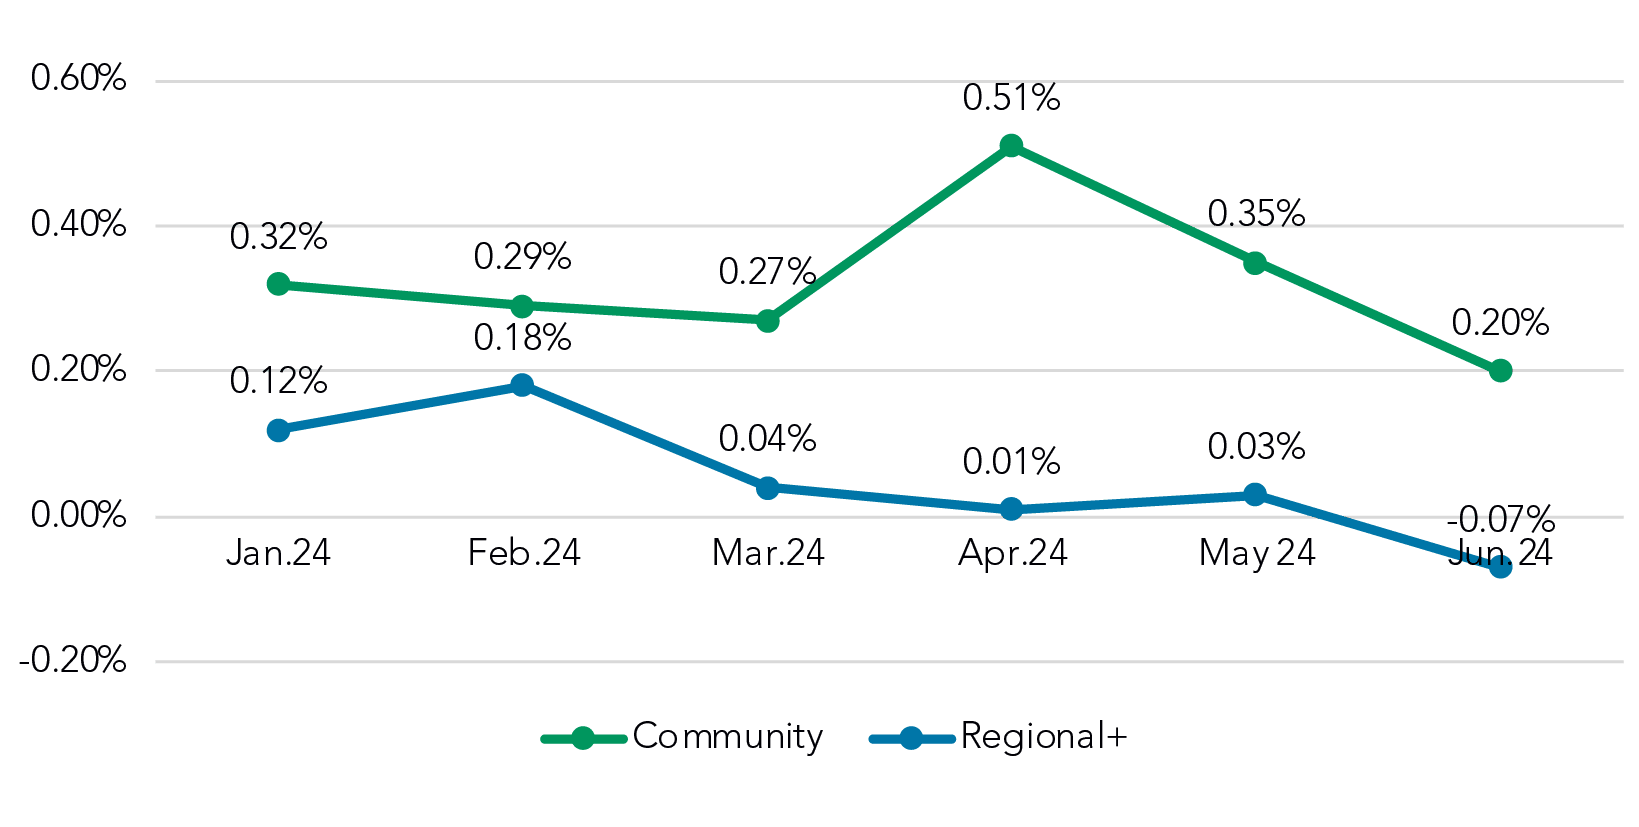
Spreads to Prime go negative at larger institutions
While the higher rate starting point means the SOFR equivalent spread for Prime structures is still 3.20%, we did think it was worth nothing that, looking purely at spreads to Prime on floating-rate deals, Regional+ prime spreads moved into negative territory in June (-.07%).
Spread to Prime
Got questions?
Our banking consultants and data scientists are combing through Q2 PrecisionLender pricing data every day. If there is anything you’d like to know about what they’re seeing, please send your questions to insights@q2.com.