Commercial Loan and Deposit Pricing Market Update: May 2025
For our May analysis of the Q2 PrecisionLender commercial loan and deposit pricing database, we looked at whether liquidity concerns are still front and centers with bankers. Our analysis includes the last information on pricing volume, funding curves, deposit rates, and liquidity premiums.
We also continued to track how bankers are faring in their pricing of new fixed-rate deals vs. those that are rolling off in 2025.
Read on for more details.
Data Notes:
- When we discuss the cost of funds (COF) on loan pricing activity, we refer to the marginal duration matched funding cost employed in pricing, not the bank’s actual average (historical) cost of funds.
- We define Regional+ as institutions with $8B+ in assets, while Community are <$8B.
Volume rises in April
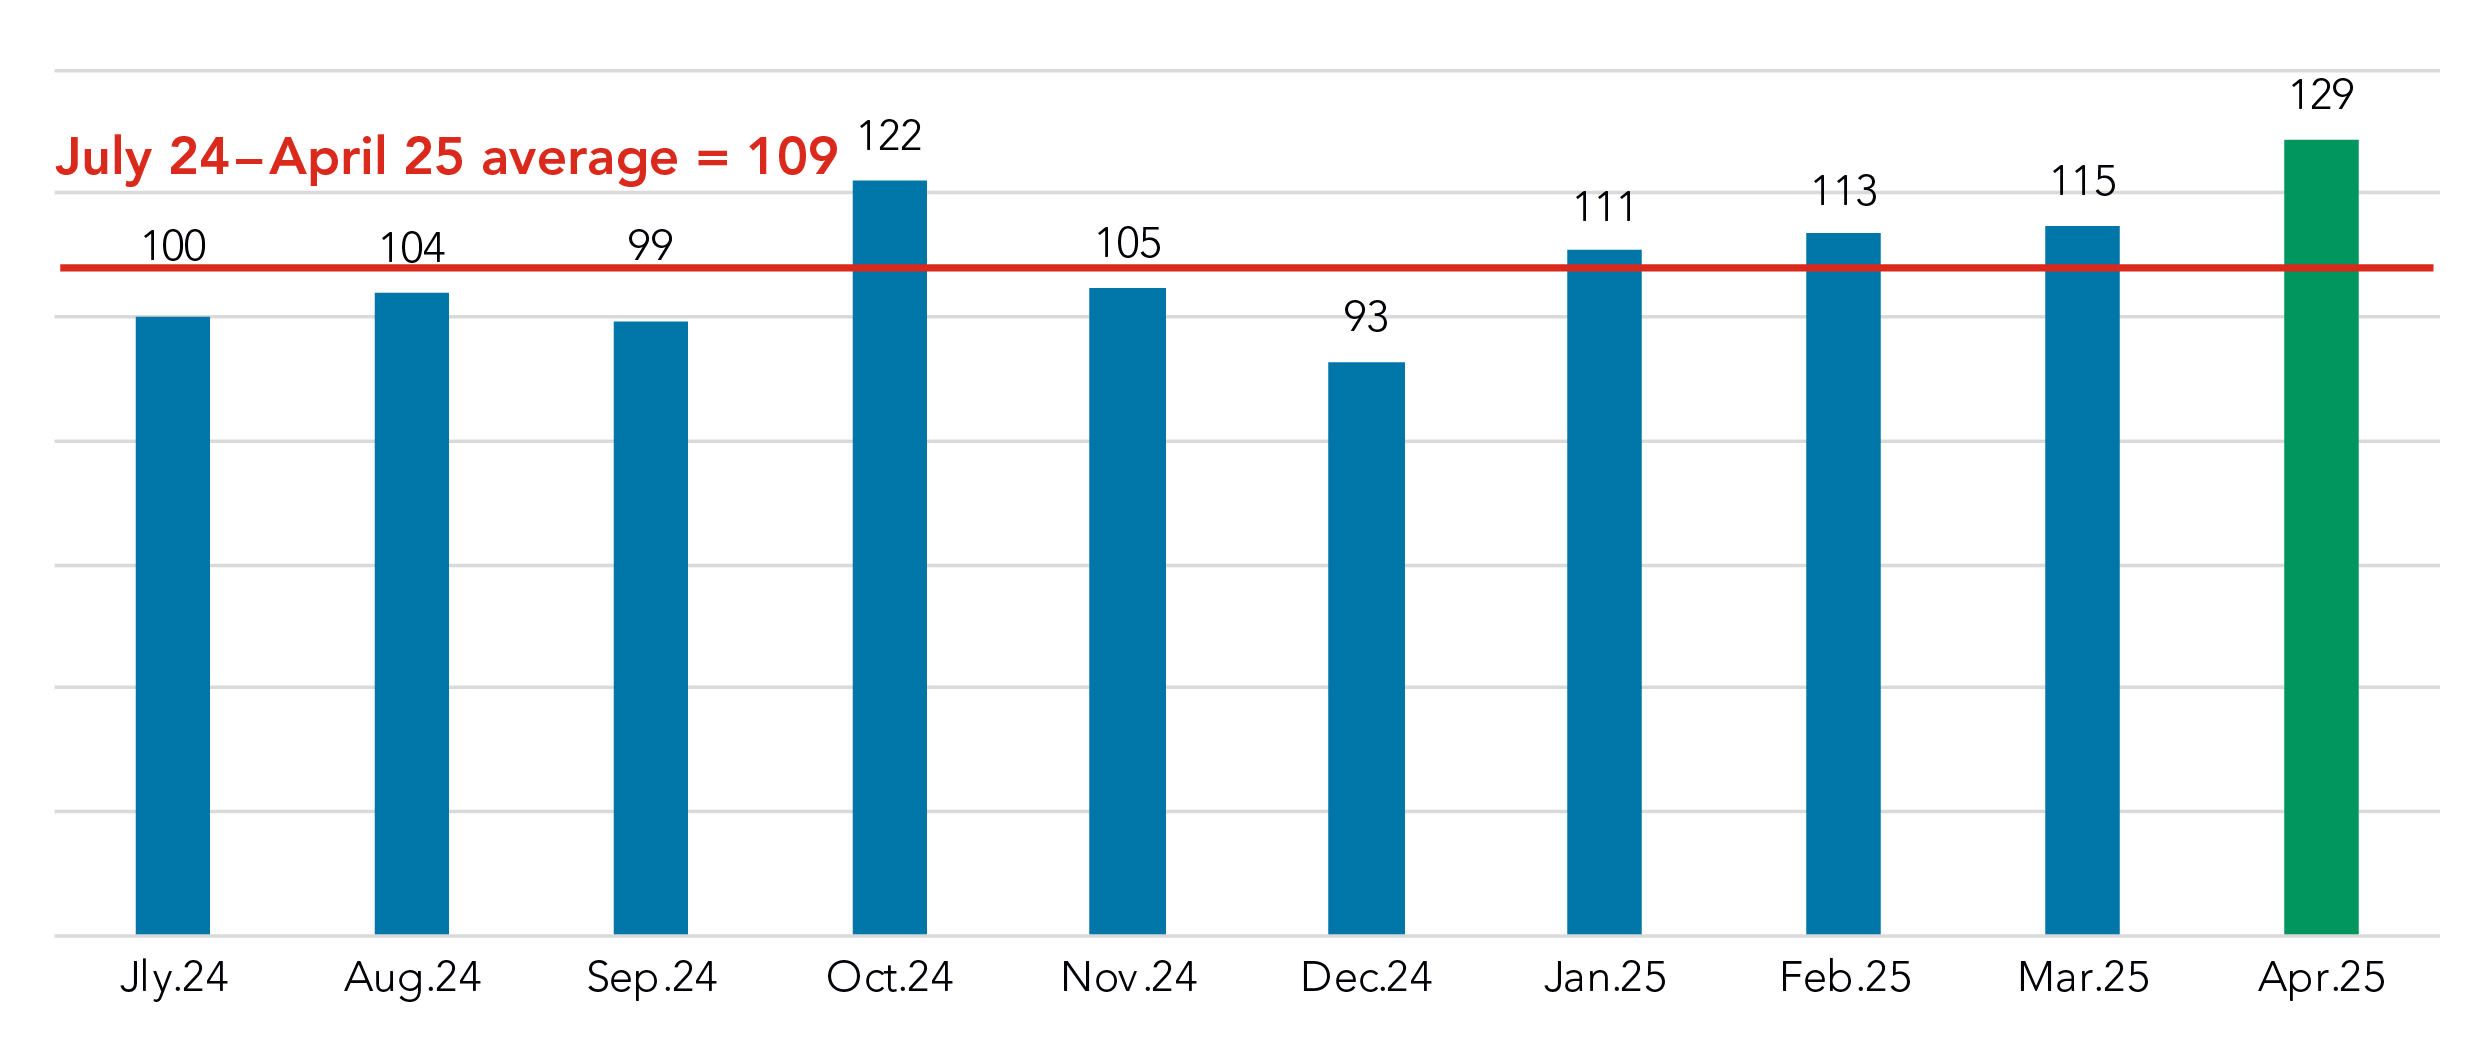
Pricing volume made a significant jump in April, well above the July 2024-April 2025 average of 109. (The monthly volumes are indexed to the July 2024 volume, which is set at 100.)
April volume was also up significantly from March – 129 vs. 115 – and was the highest mark captured in this 10-month cohort. We found the volume uptick to be widespread across FIs.
Priced Commercial Loan Volume in $
Indexed to January 2024 = 100
SOFR spreads lack resilience
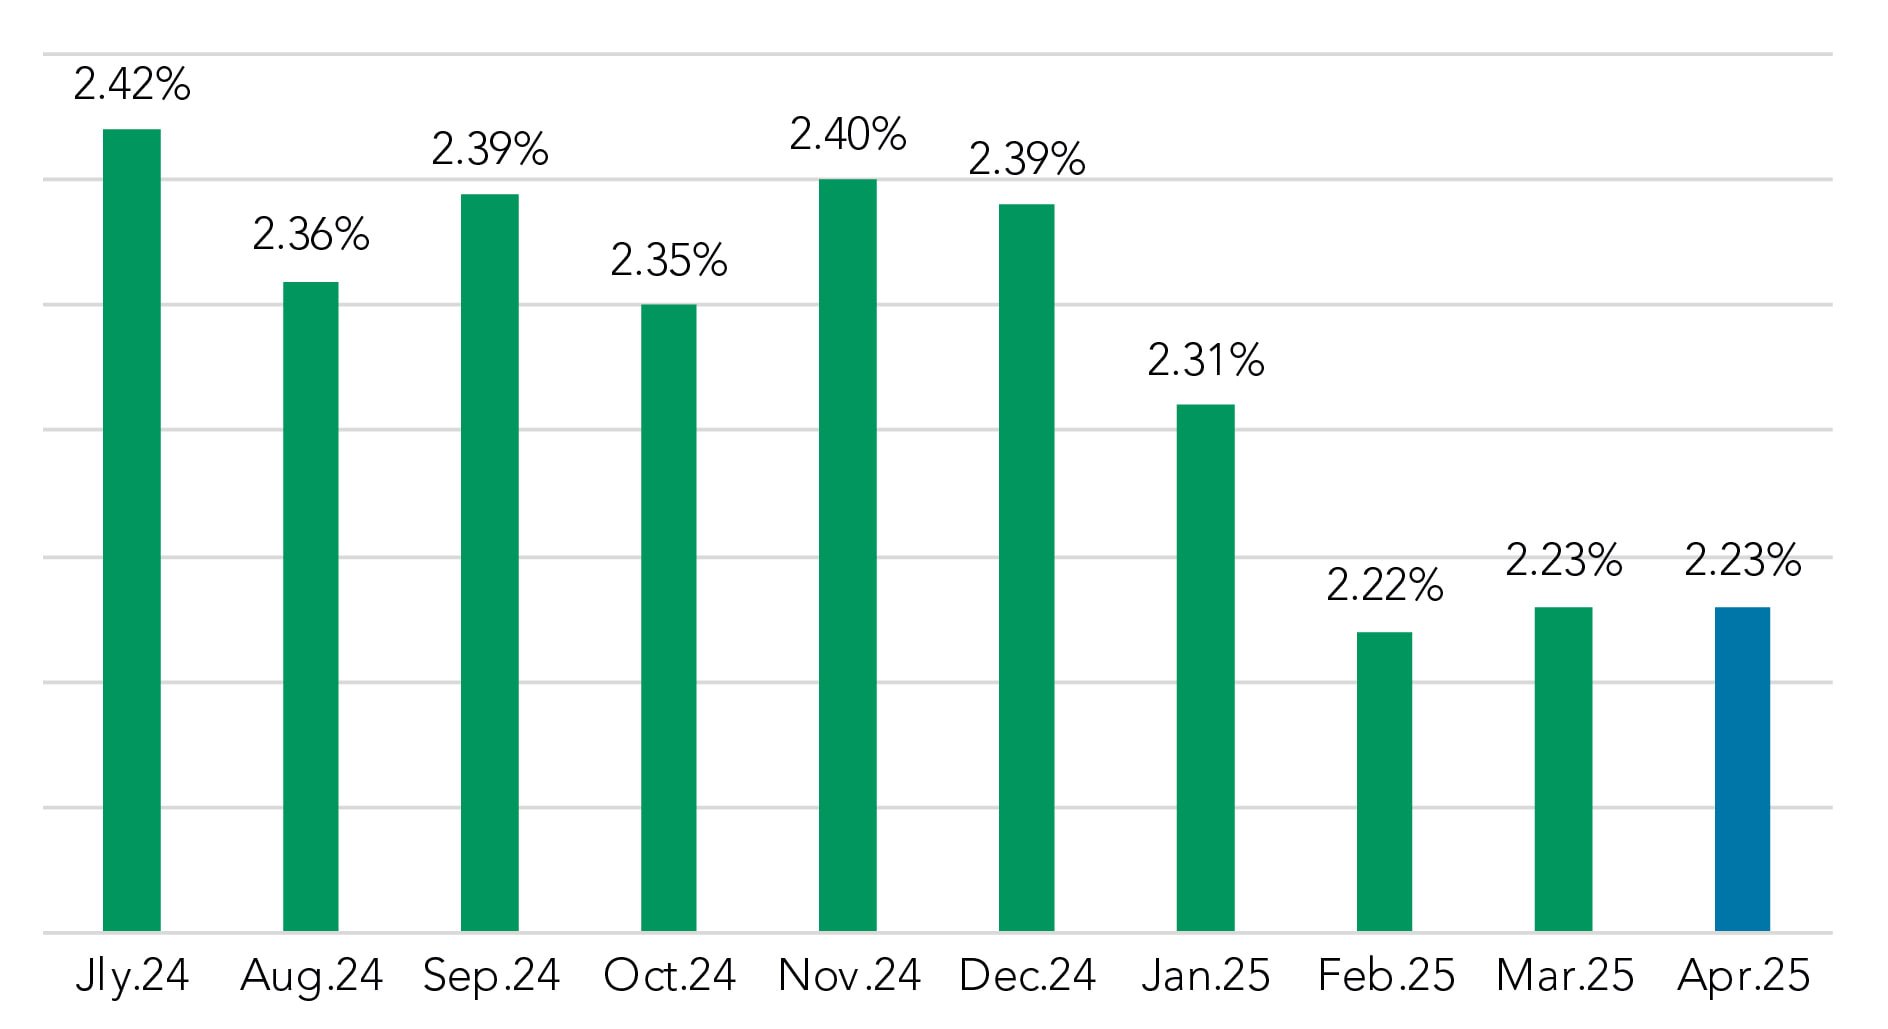
Spreads on SOFR loans were virtually unchanged in April, remaining at 2.23%. However, since December 2024, spreads to SOFR are down 16 bps (2.39% to 2.23%).
When describing SOFR spreads in the aftermath of the Fed rate cuts in 2024 and the trends of 2025, the phrase that comes to mind is, “Lacking resilience.” Bankers are passing on those fed rate cuts to borrowers in the form of lower interest costs—and a bit more via reduced spread to the index.
Weighted Average Spread to SOFR
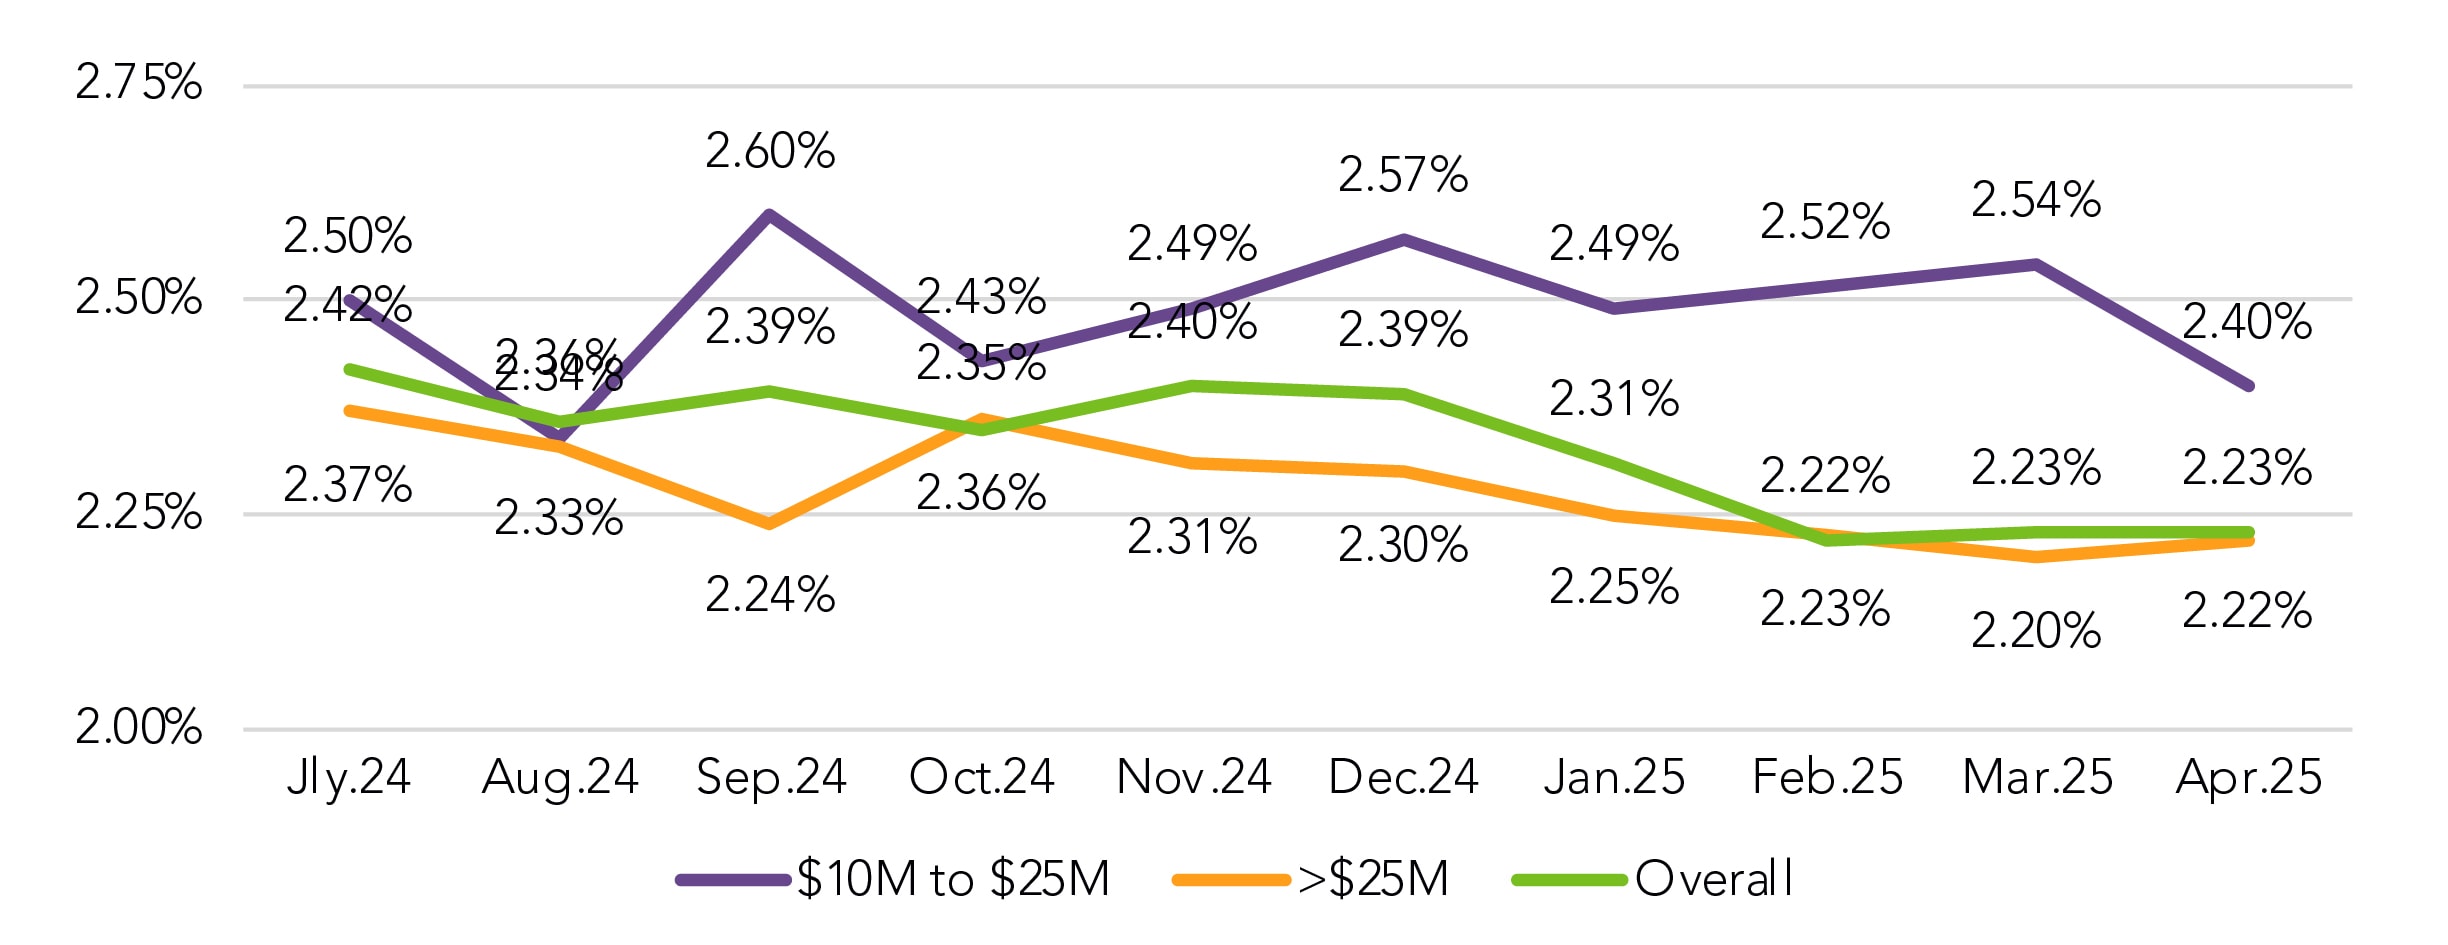
We’ve also been asked recently about what these spreads look like when segmented by commitment amount. We found that, while there was a 14-bps month-over-month drop in spreads on deals in the $10-25M range, it was essentially offset by the 2 bps increase in the larger (<$25M) deals.
Spread to SOFR on Floating Rate Loans by Commitment Amount
Fixed-rate spreads also lack resilience
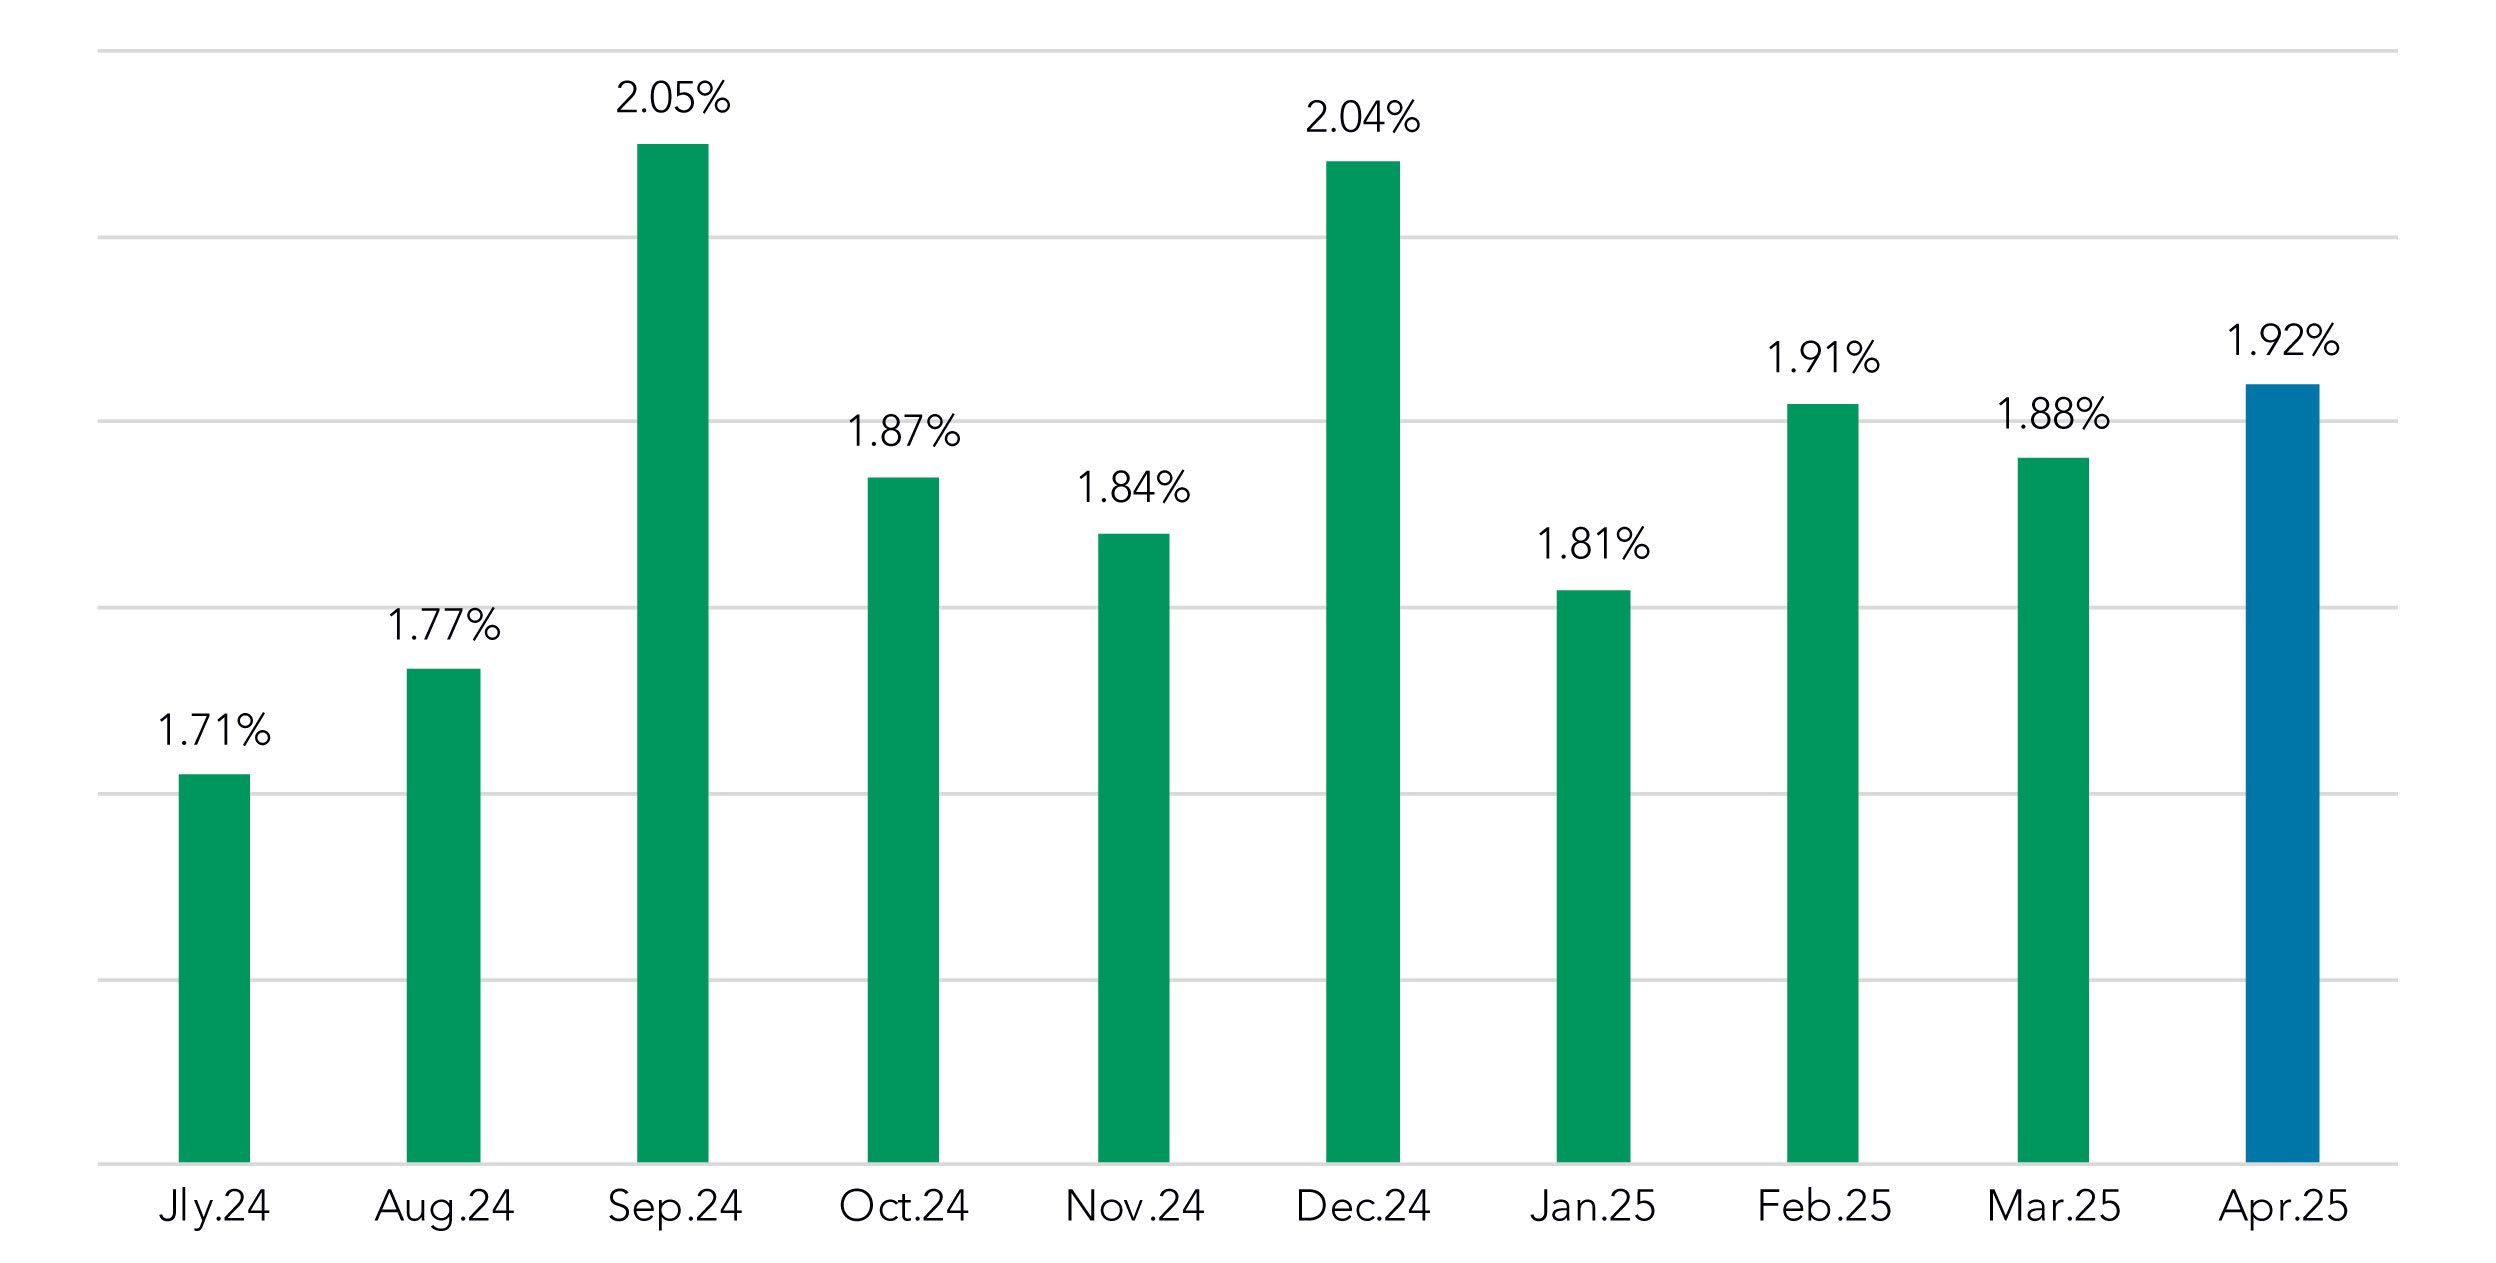
It’s been a similar “lack of resilience” story for fixed-rate structures in 2025. The fixed-rate coupon over cost of funds did increase by 4 bps in April (1.88% to 1.92%), but that’s just a relative victory. The metric is still down 12 bps from December 2024 (2.04% to 1.92%) and is still 31 bps below the spread to SOFR (2.23% to 1.92%)—in other words, the revenue discount of fixed rate structures to SOFR continues.
Fixed Rate Coupon Over COF
Yield curve continues to invert near-term and “normalize” long term
The shorter-term section of the FHLB continued to drop from the March 29 snapshot to the April 30 snapshot, with the 24-month rate down 26 bps (4.08% to 3.82%) and the 60-month rate down 19 bps (4.18% to 3.99%). Meanwhile, at the far end of the curve, the 240-month rate (5.25% to 5.32%) and the 360-month rate (5.35% to 5.42%) were both up 7 bps since the last snapshot.
FHBL Curve, Selected Dates
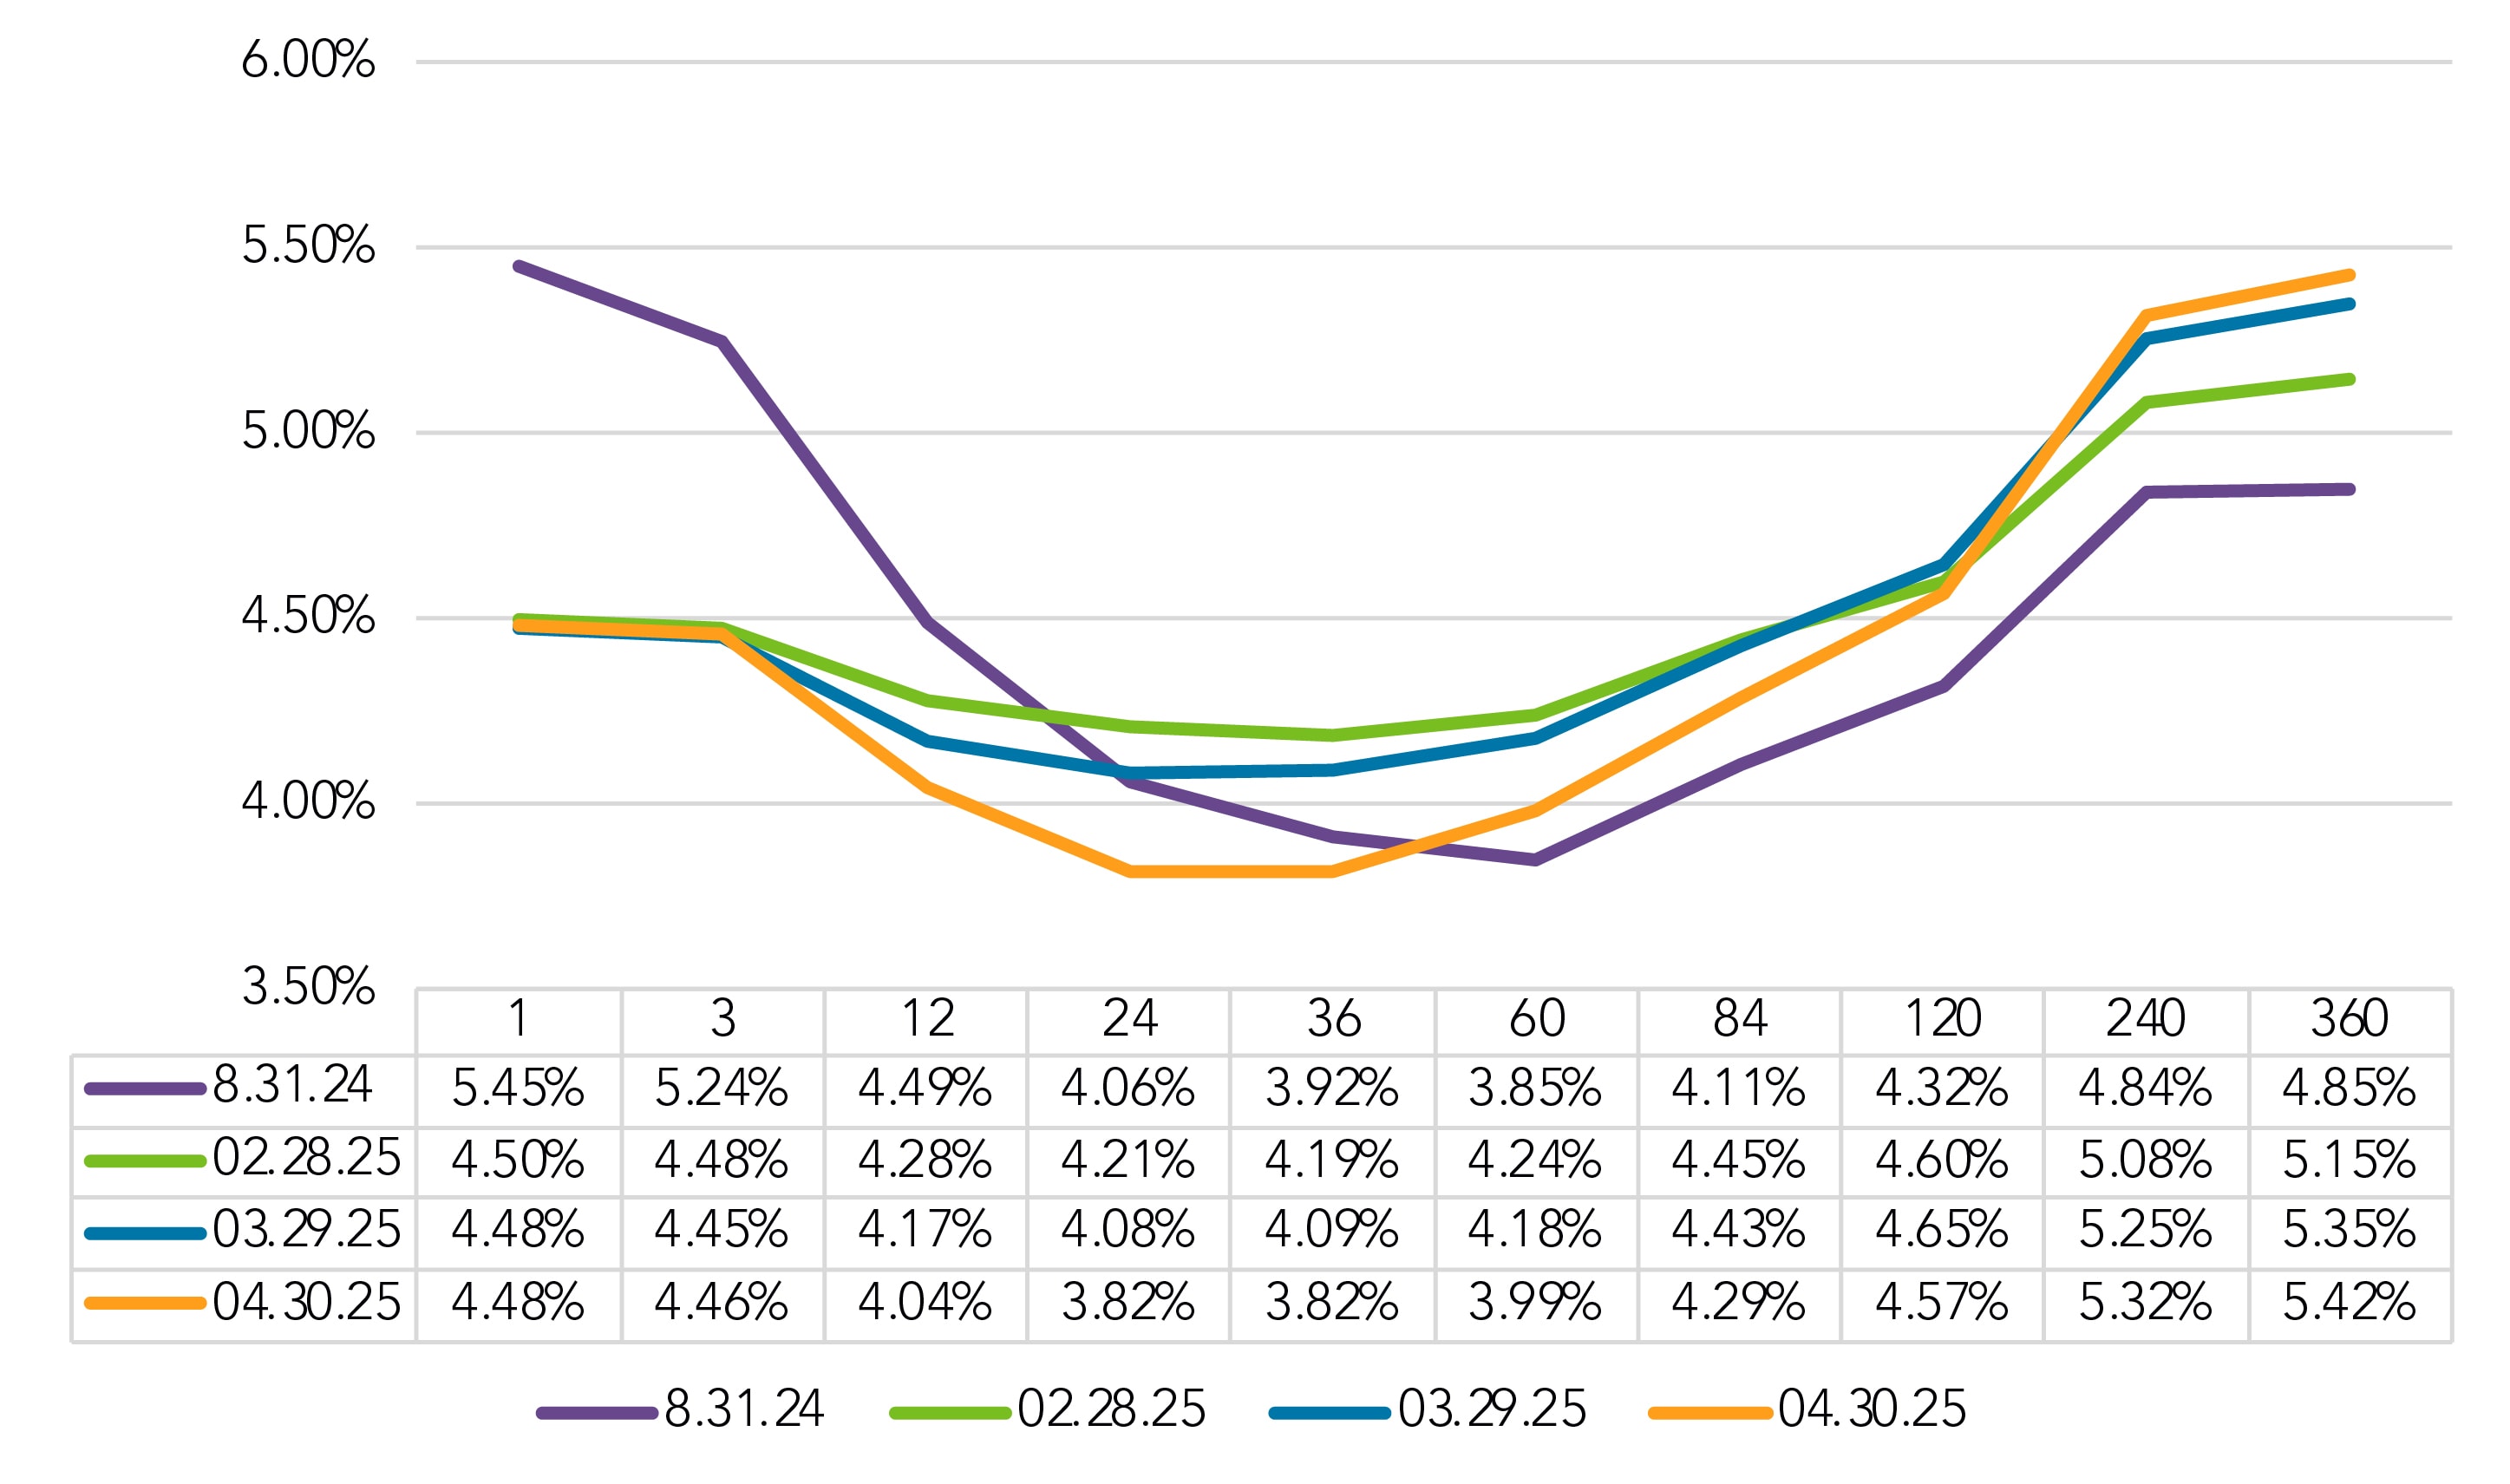
The result is a curve in which the inversion is growing for short-term maturities but then is steepening on a more “traditional” trajectory on longer-term maturities.
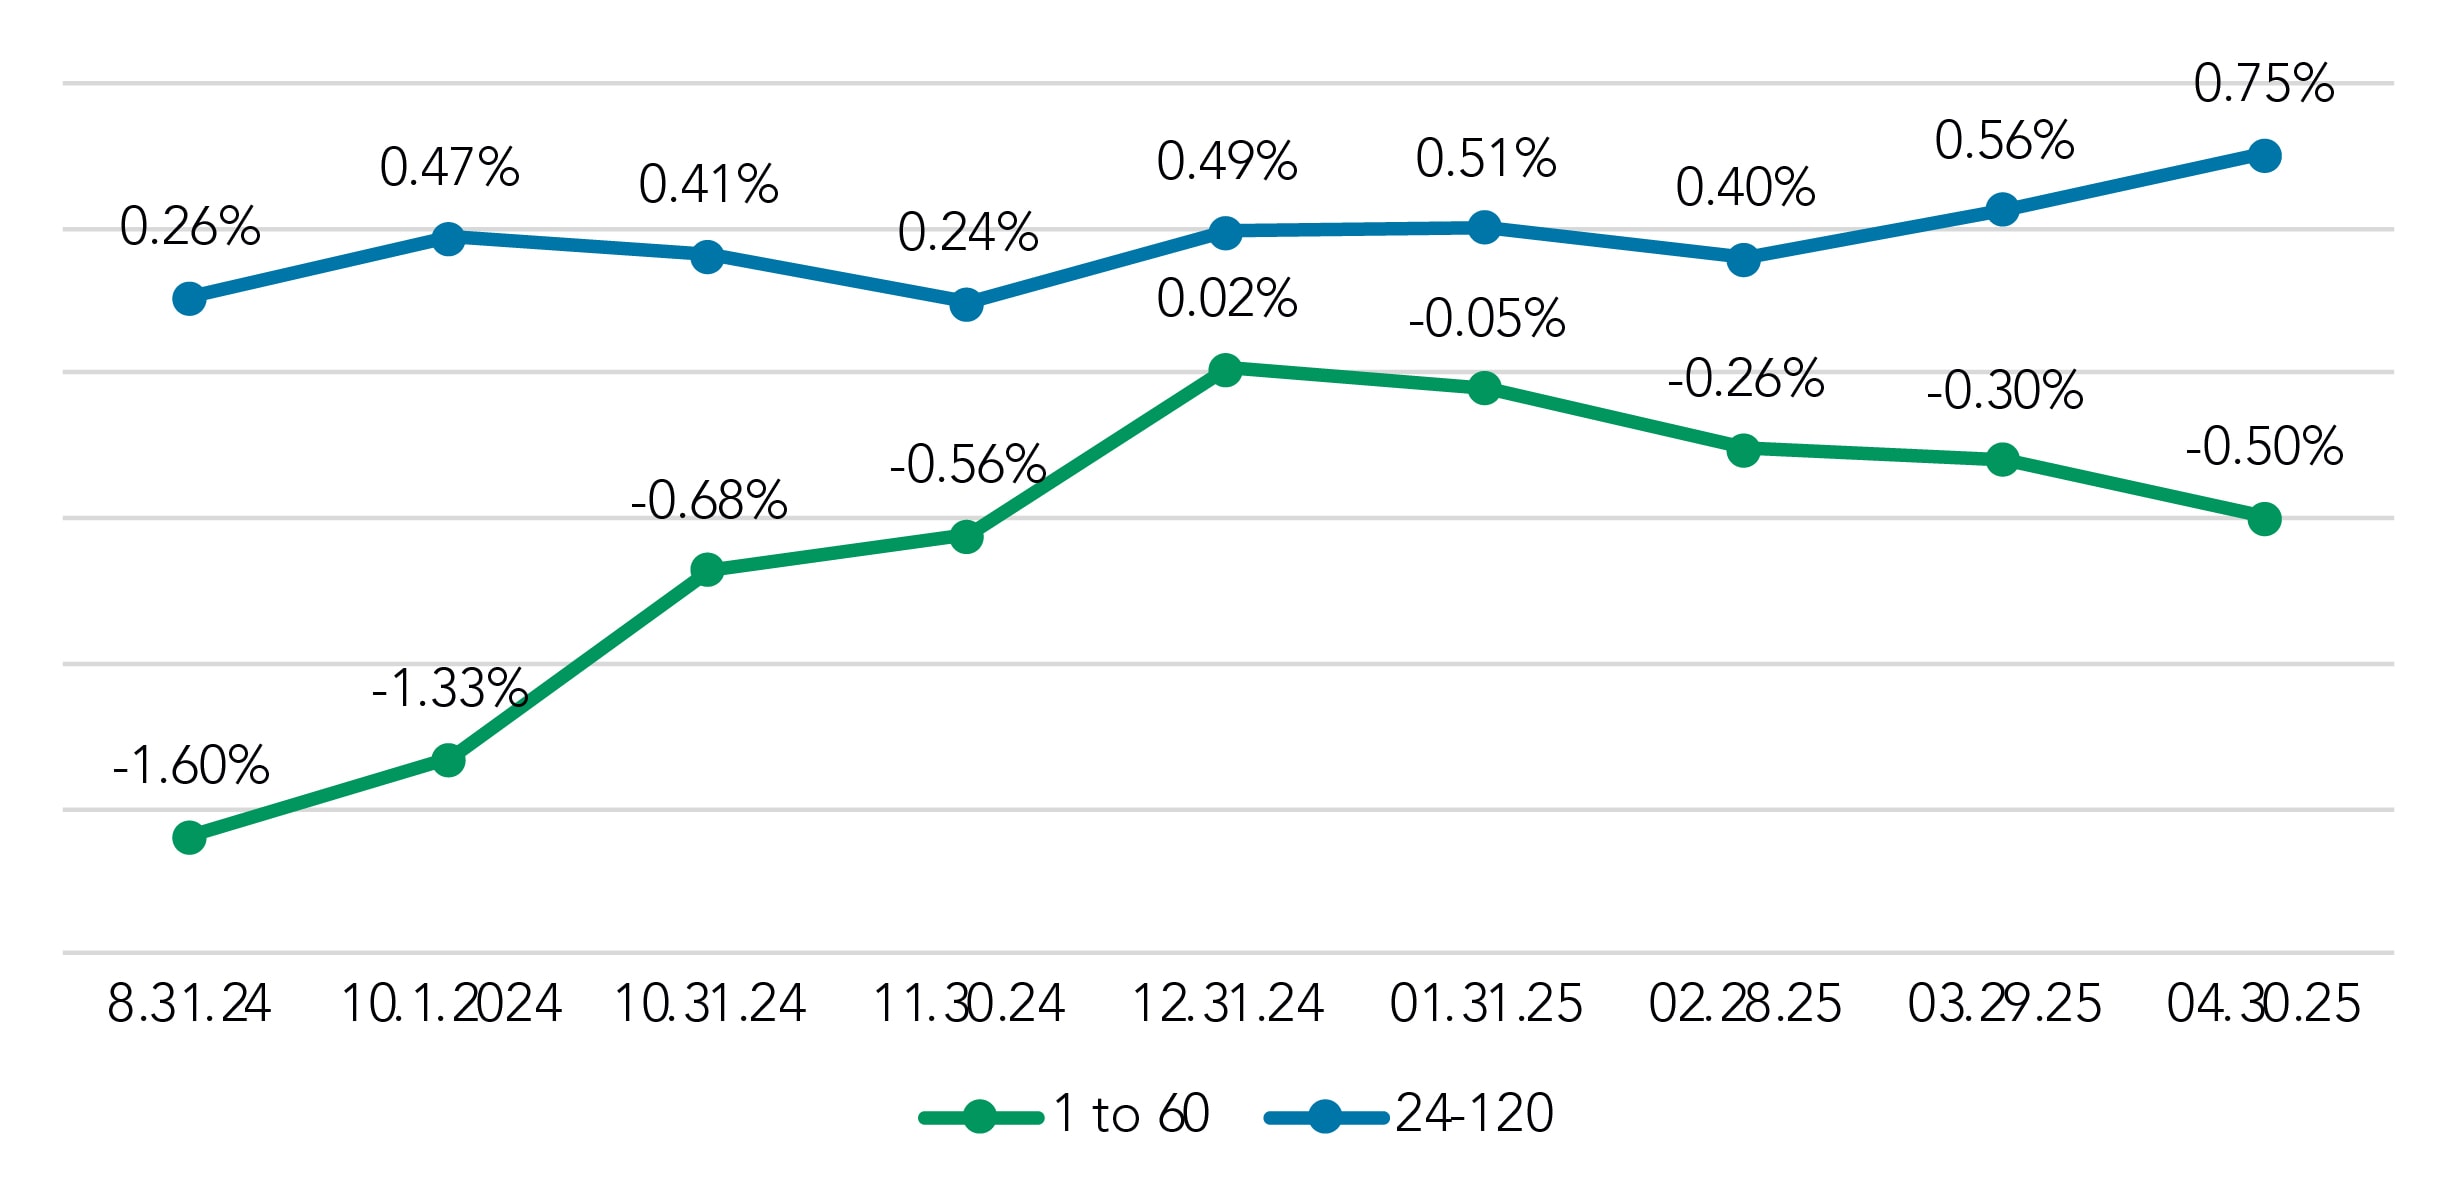
Put another way, the FHLB carry form 1- to 60-months, is now at -0.50%, after it had reached positive territory, 0.02%, at the end of December. Meanwhile the FHLB carry from 24- to 120-months is at 0.75% in the April 30 snapshot, up from 0.49% on Dec. 31st .
FHLB Carry
1 to 60 Months vs. 24 to 120 Months
Liquidity costs continue to rise
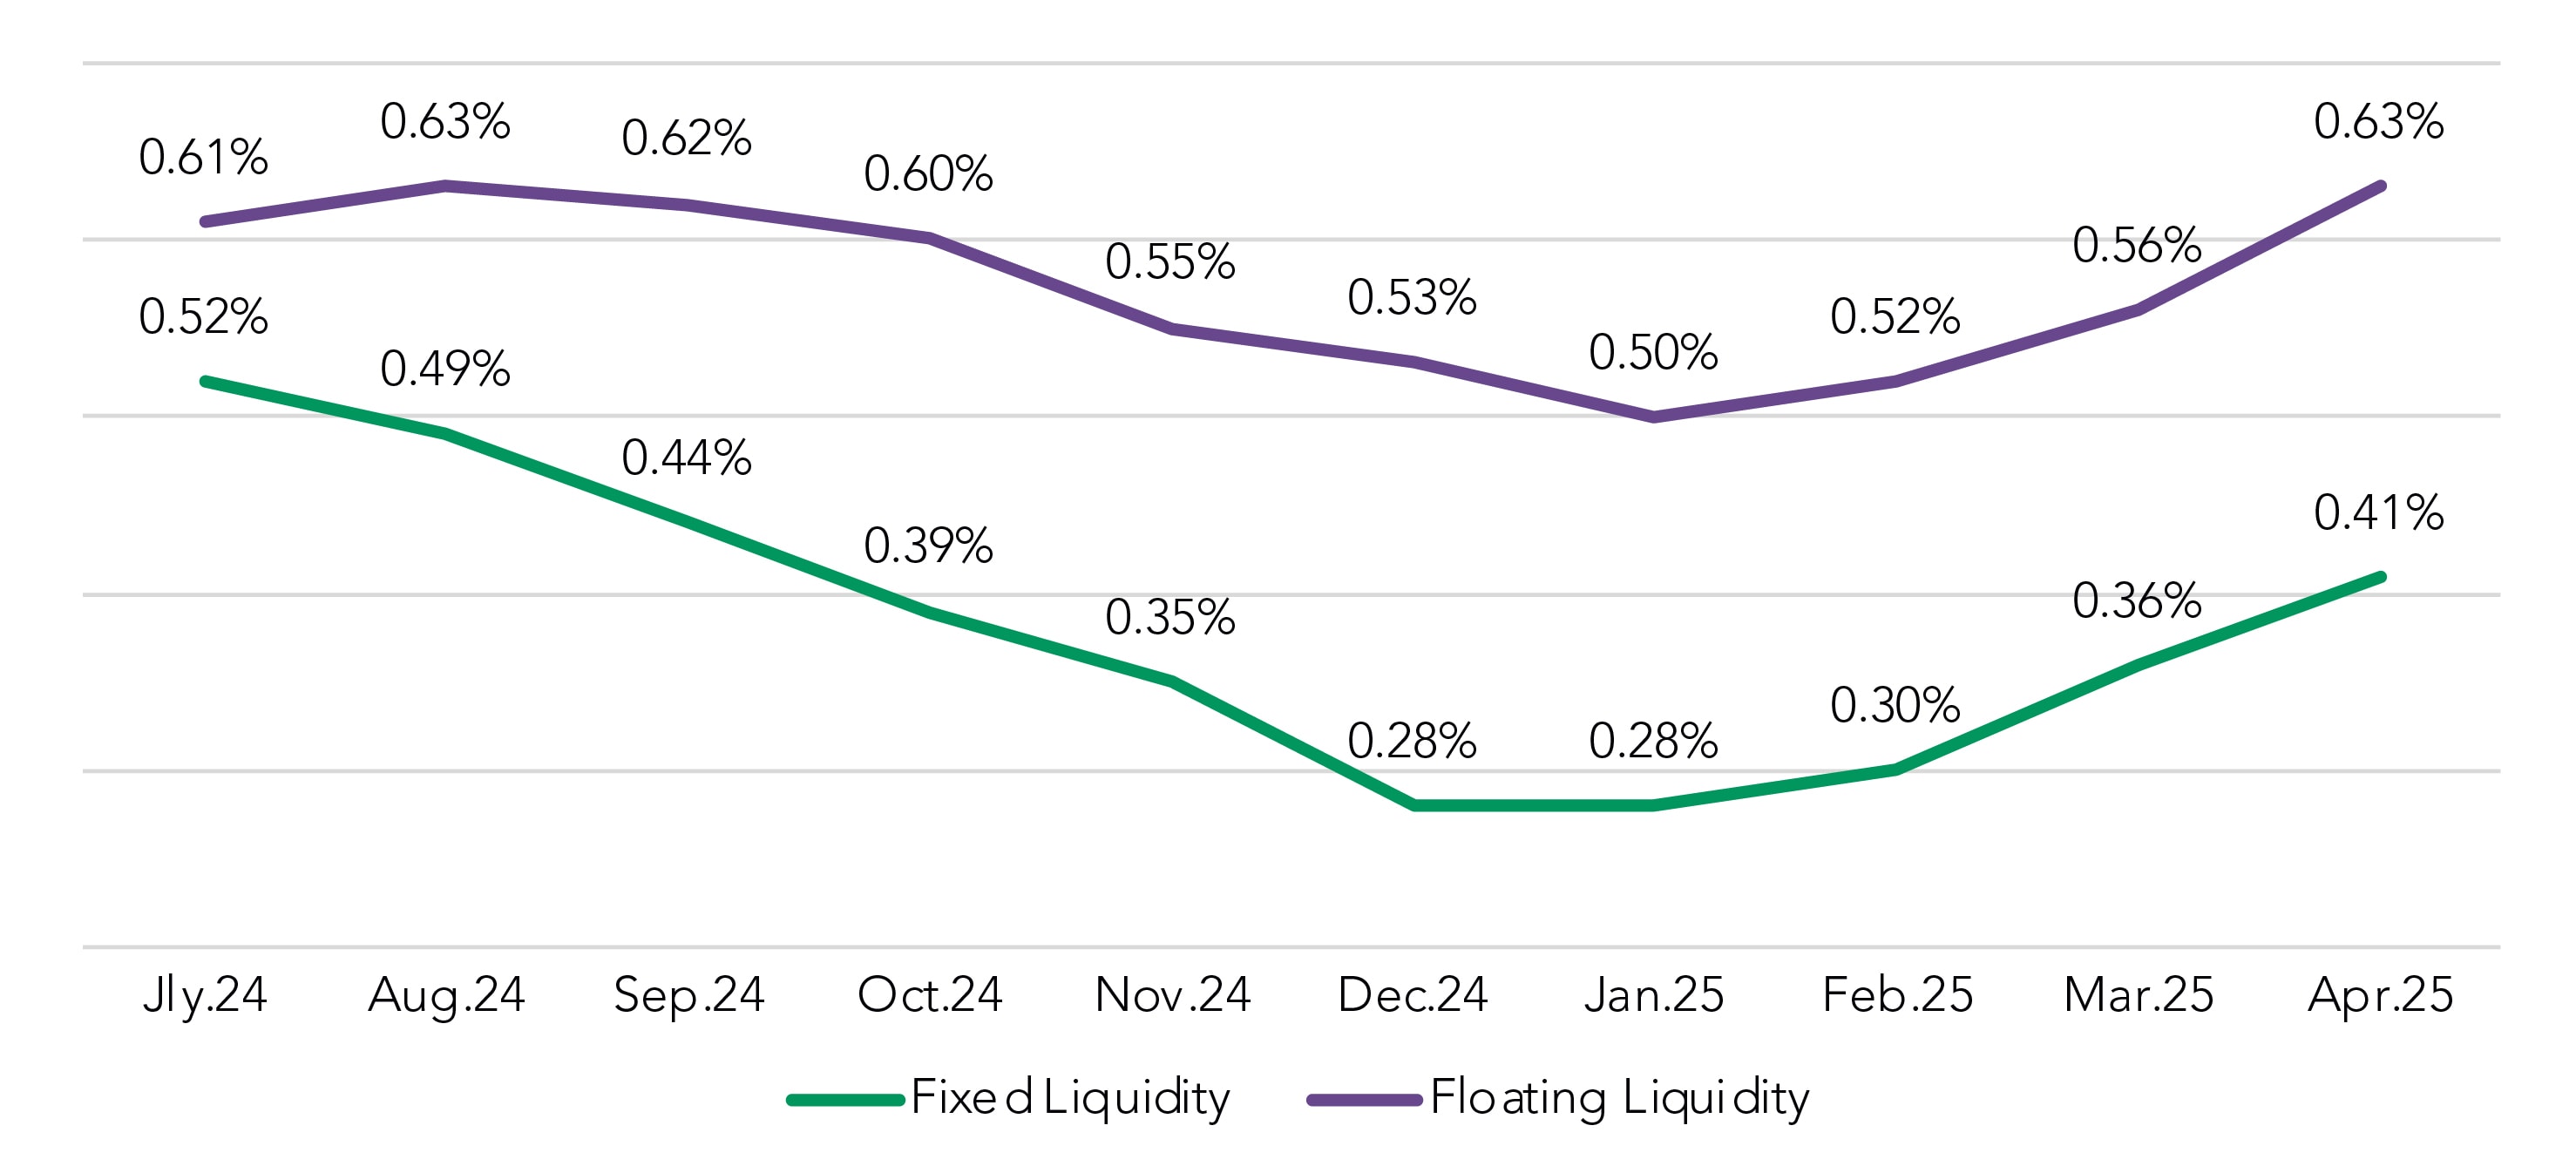
While base funding curves are flat at the one month point and falling inside 60 months, pricing managers have been adding more liquidity costs into their calculations, both fixed- and floating-rate structures, in recent months. Floating liquidity costs are up 7 bps since March (0.56% to 0.63%) while fixed liquidity costs rose 5 bps (0.36% to 0.41%) during the same period. This has the effect of increasing the costs bankers need to cover in their pricing activity; spread measurements indicate they have not been able to recover these costs.
Approximate Liquidity Cost, Rolling Trend
Several factors could be contributing to the increase in liquidity costs. As noted before, the increase in pricing volume likely indicates that bankers expect to have more loans to fund. Later we’ll look at what impact, if any, deposit rates and volume might be having.
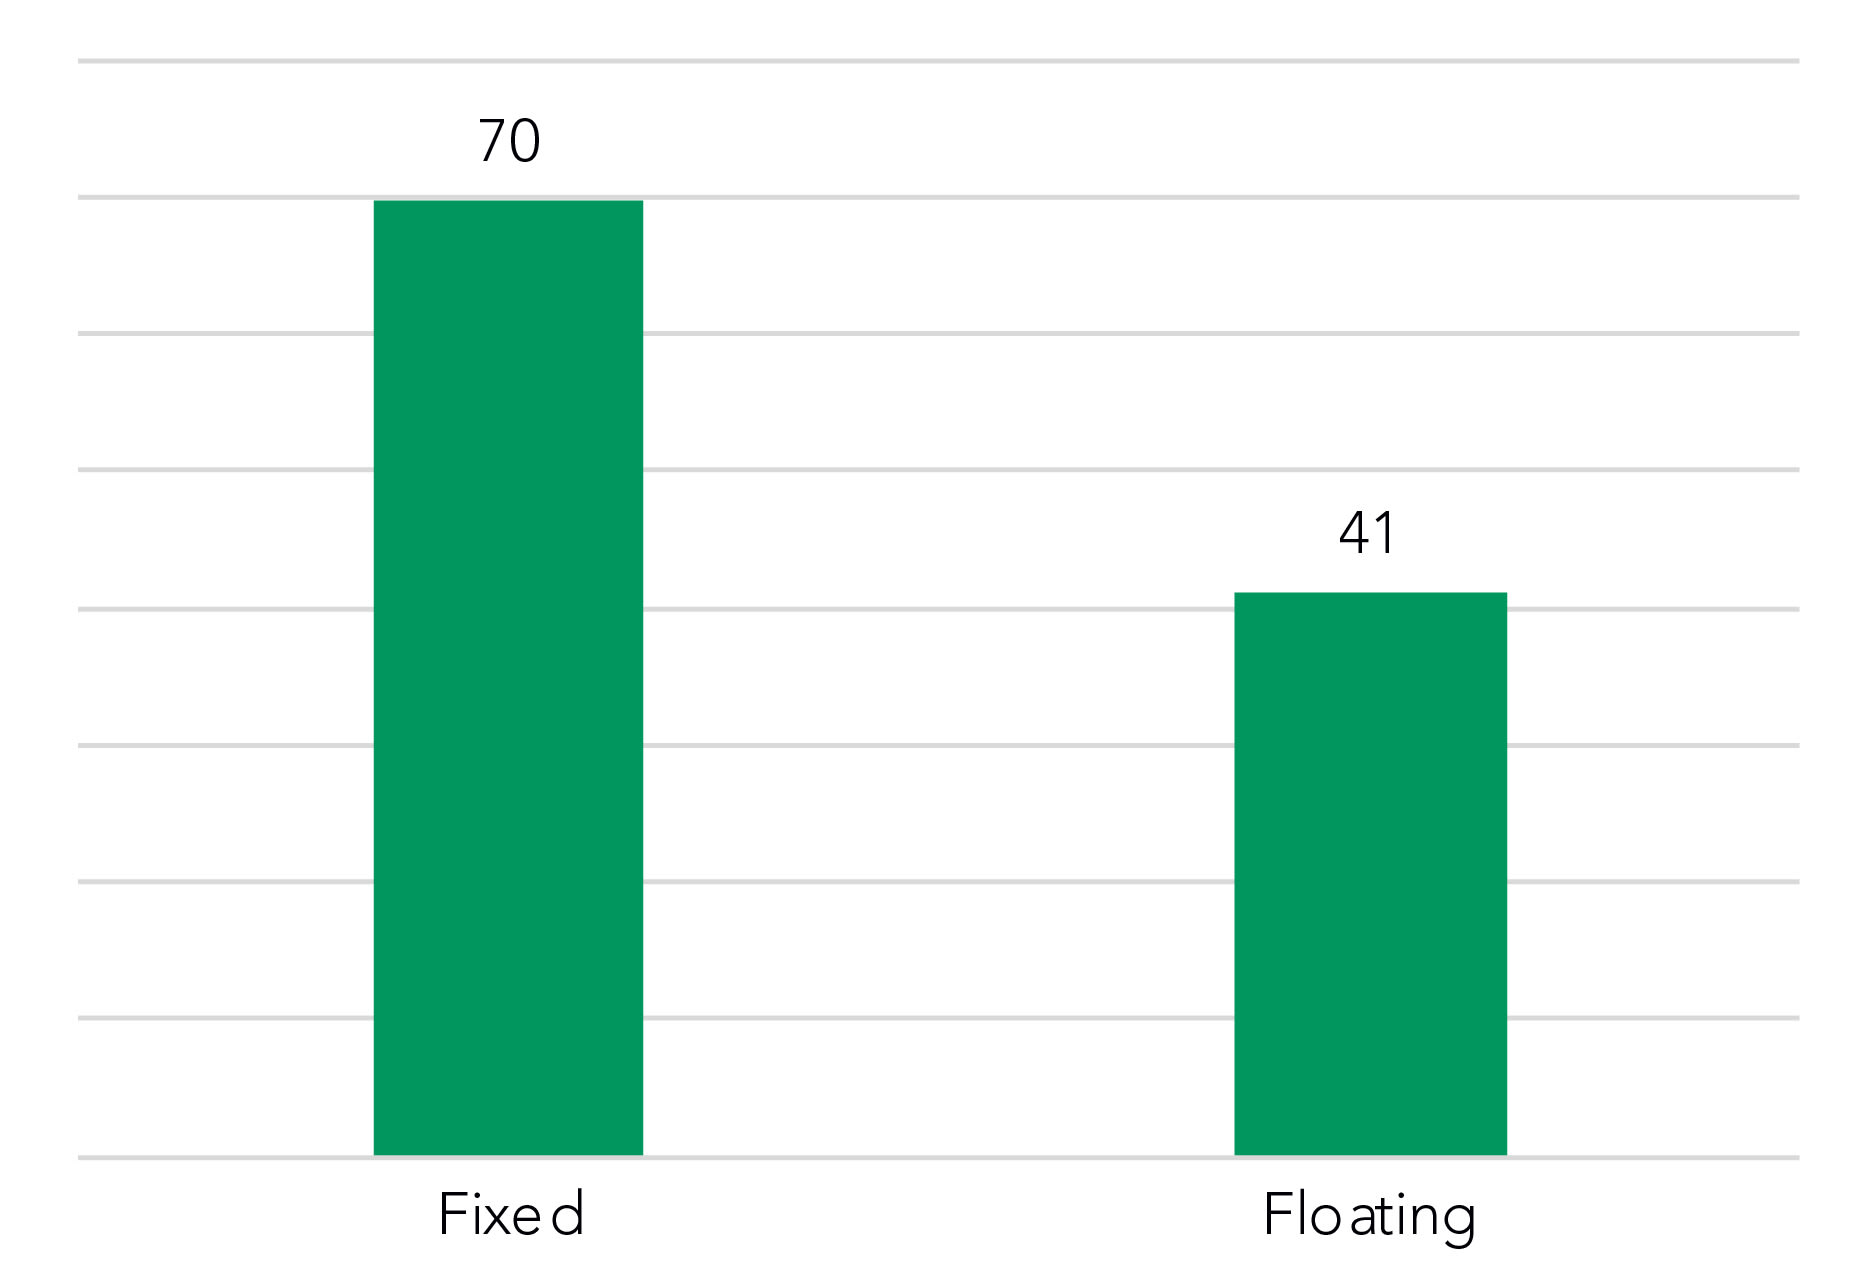
Meanwhile, we’ve also fielded several questions from bankers about what we’re seeing re: loan maturity trends for priced loans. Looking back on the period since July 2024 revealed no real material shifts in the average maturities for floating-rate (41 months) or fixed-rate (70 months). We also noted that adjustable-rate loans have largely hovered around the 120-month average during that same period.
Overall Maturity in Months
Since July 2024
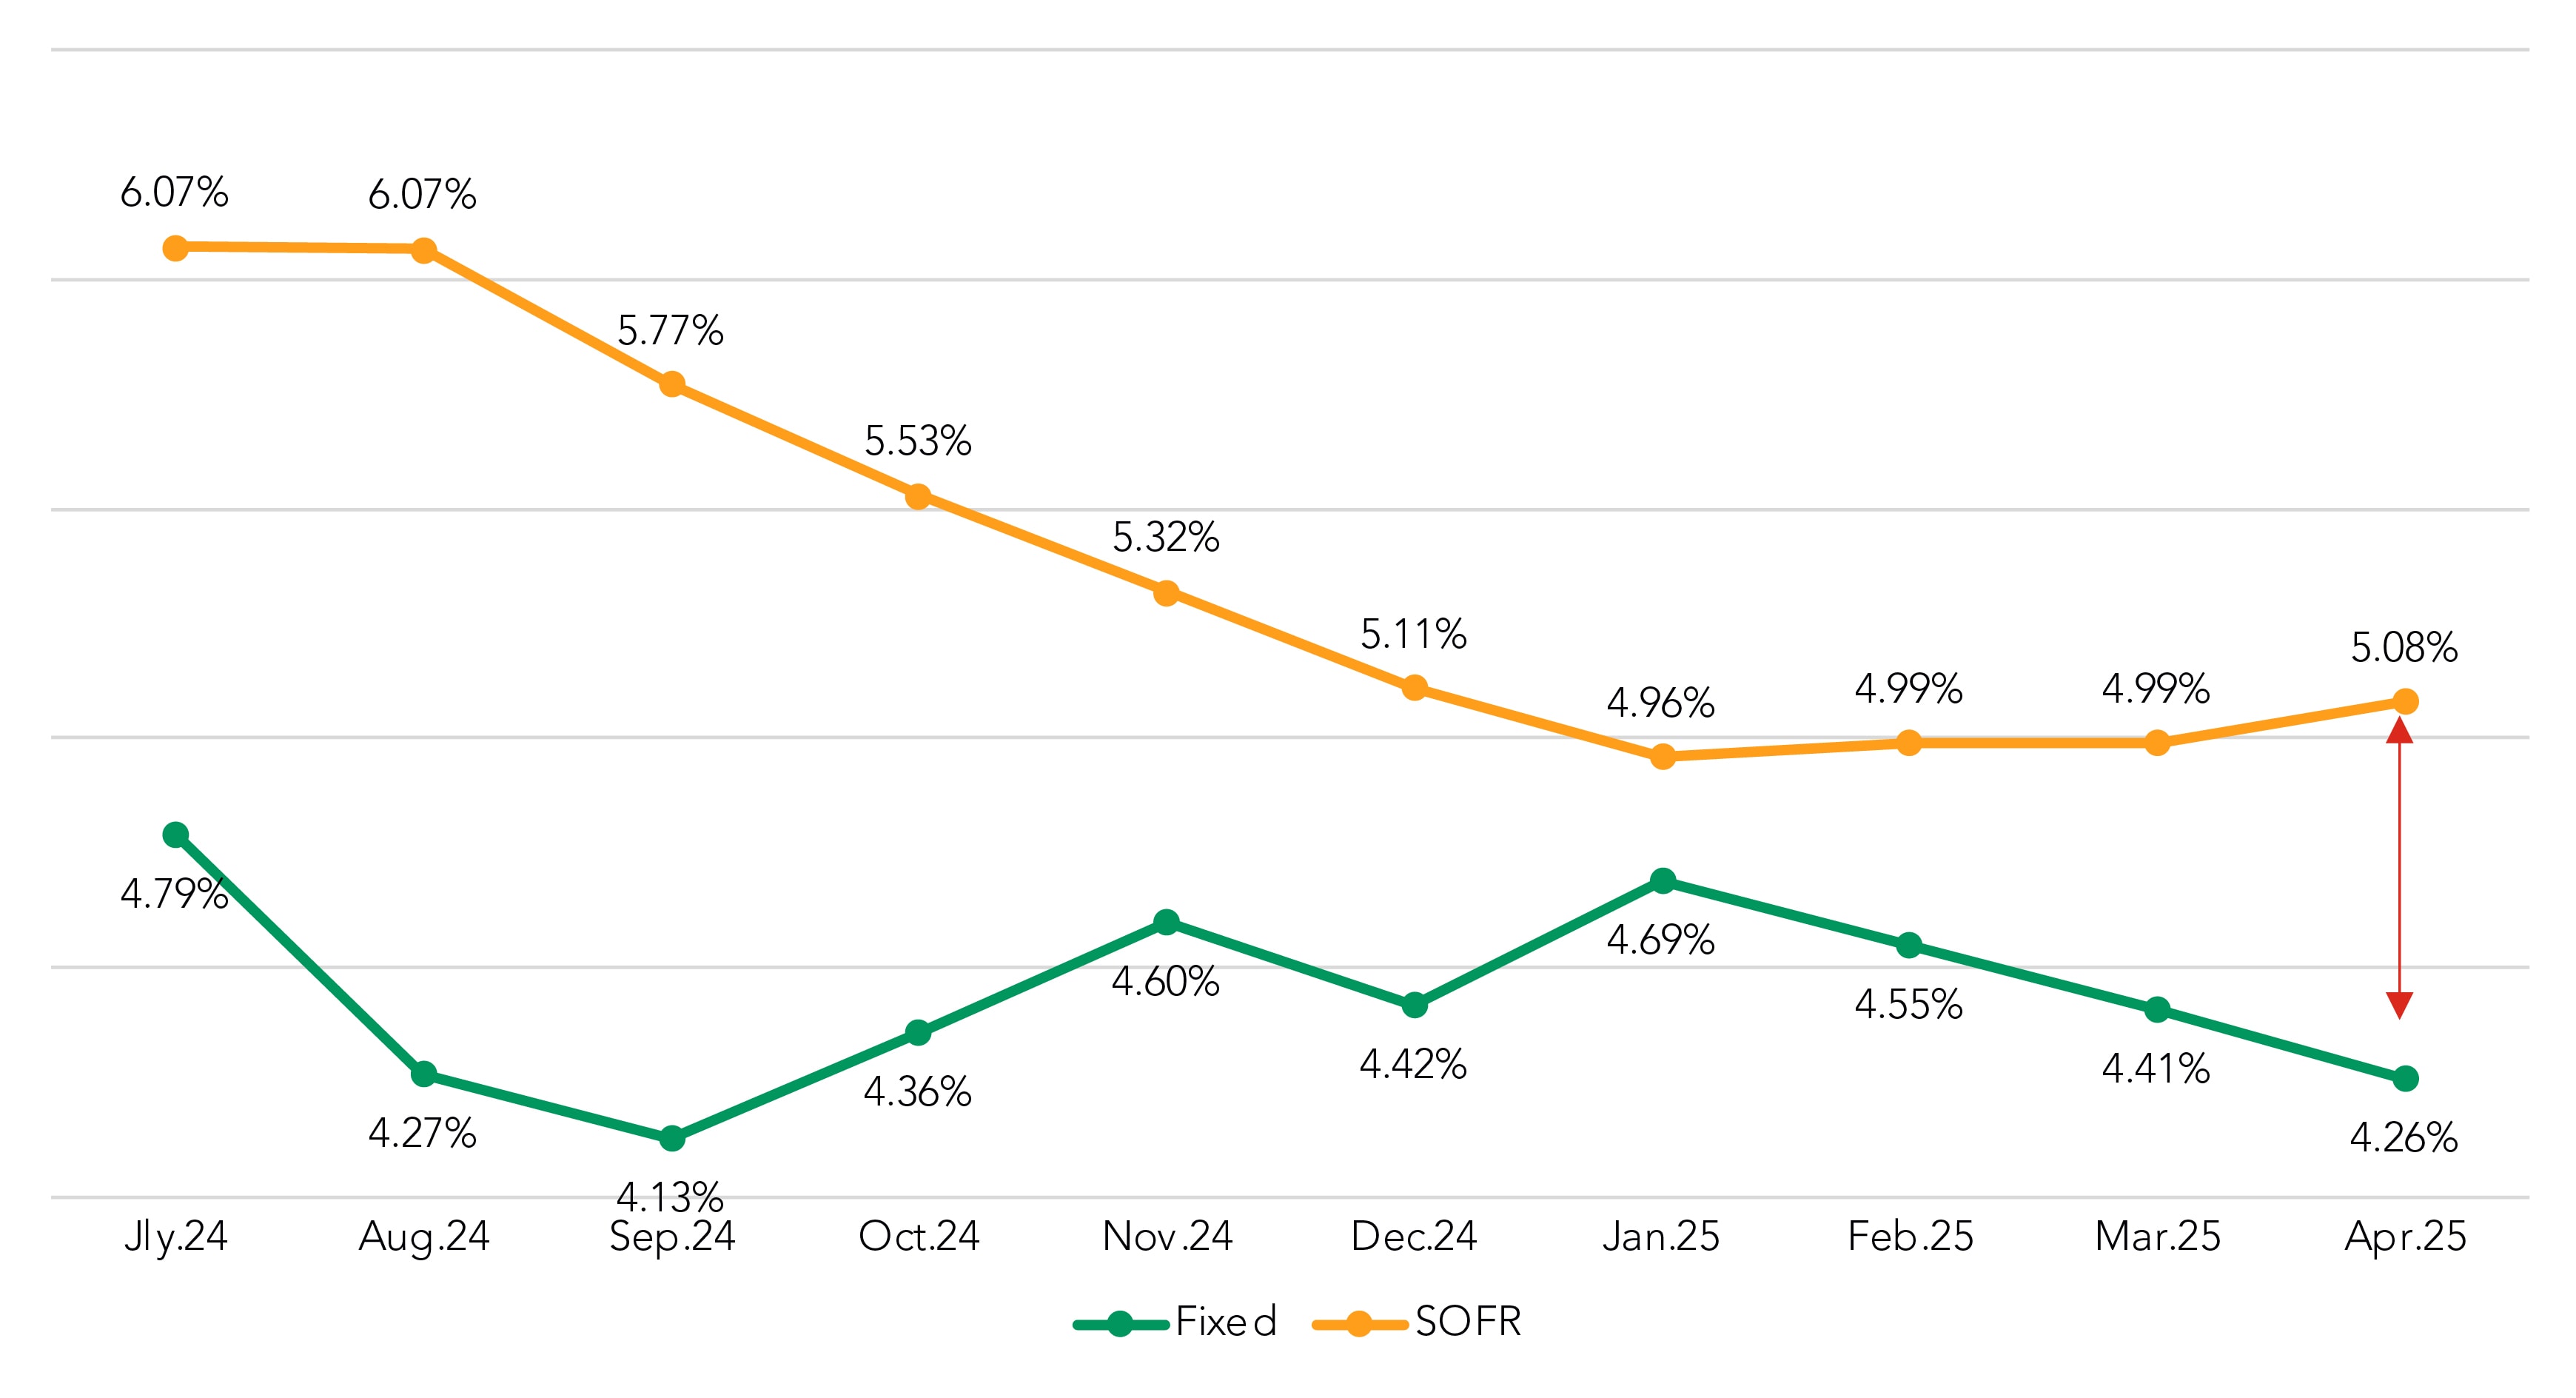
COF All-In diverges on floating and fixed structures
Increased liquidity costs for floating-rate structures, when coupled with no change in on the funding curve, resulted in a 9 bps increase in the COF All-In calculation (4.99% to 5.08%).
Meanwhile, the liquidity cost increase for fixed-rate deals partially offset the ~20 bps drop on the funding curve, leading to a 15-bps drop (4.41% to 4.26%)
After getting as close as 27 bps in January (4.96% to 4.69%) the COF gap between SOFR-based floating-rate loans and fixed-rate loans has now widened to 82 bps (5.08% to 4.26%).
All in COF by Month
Rolling Trend
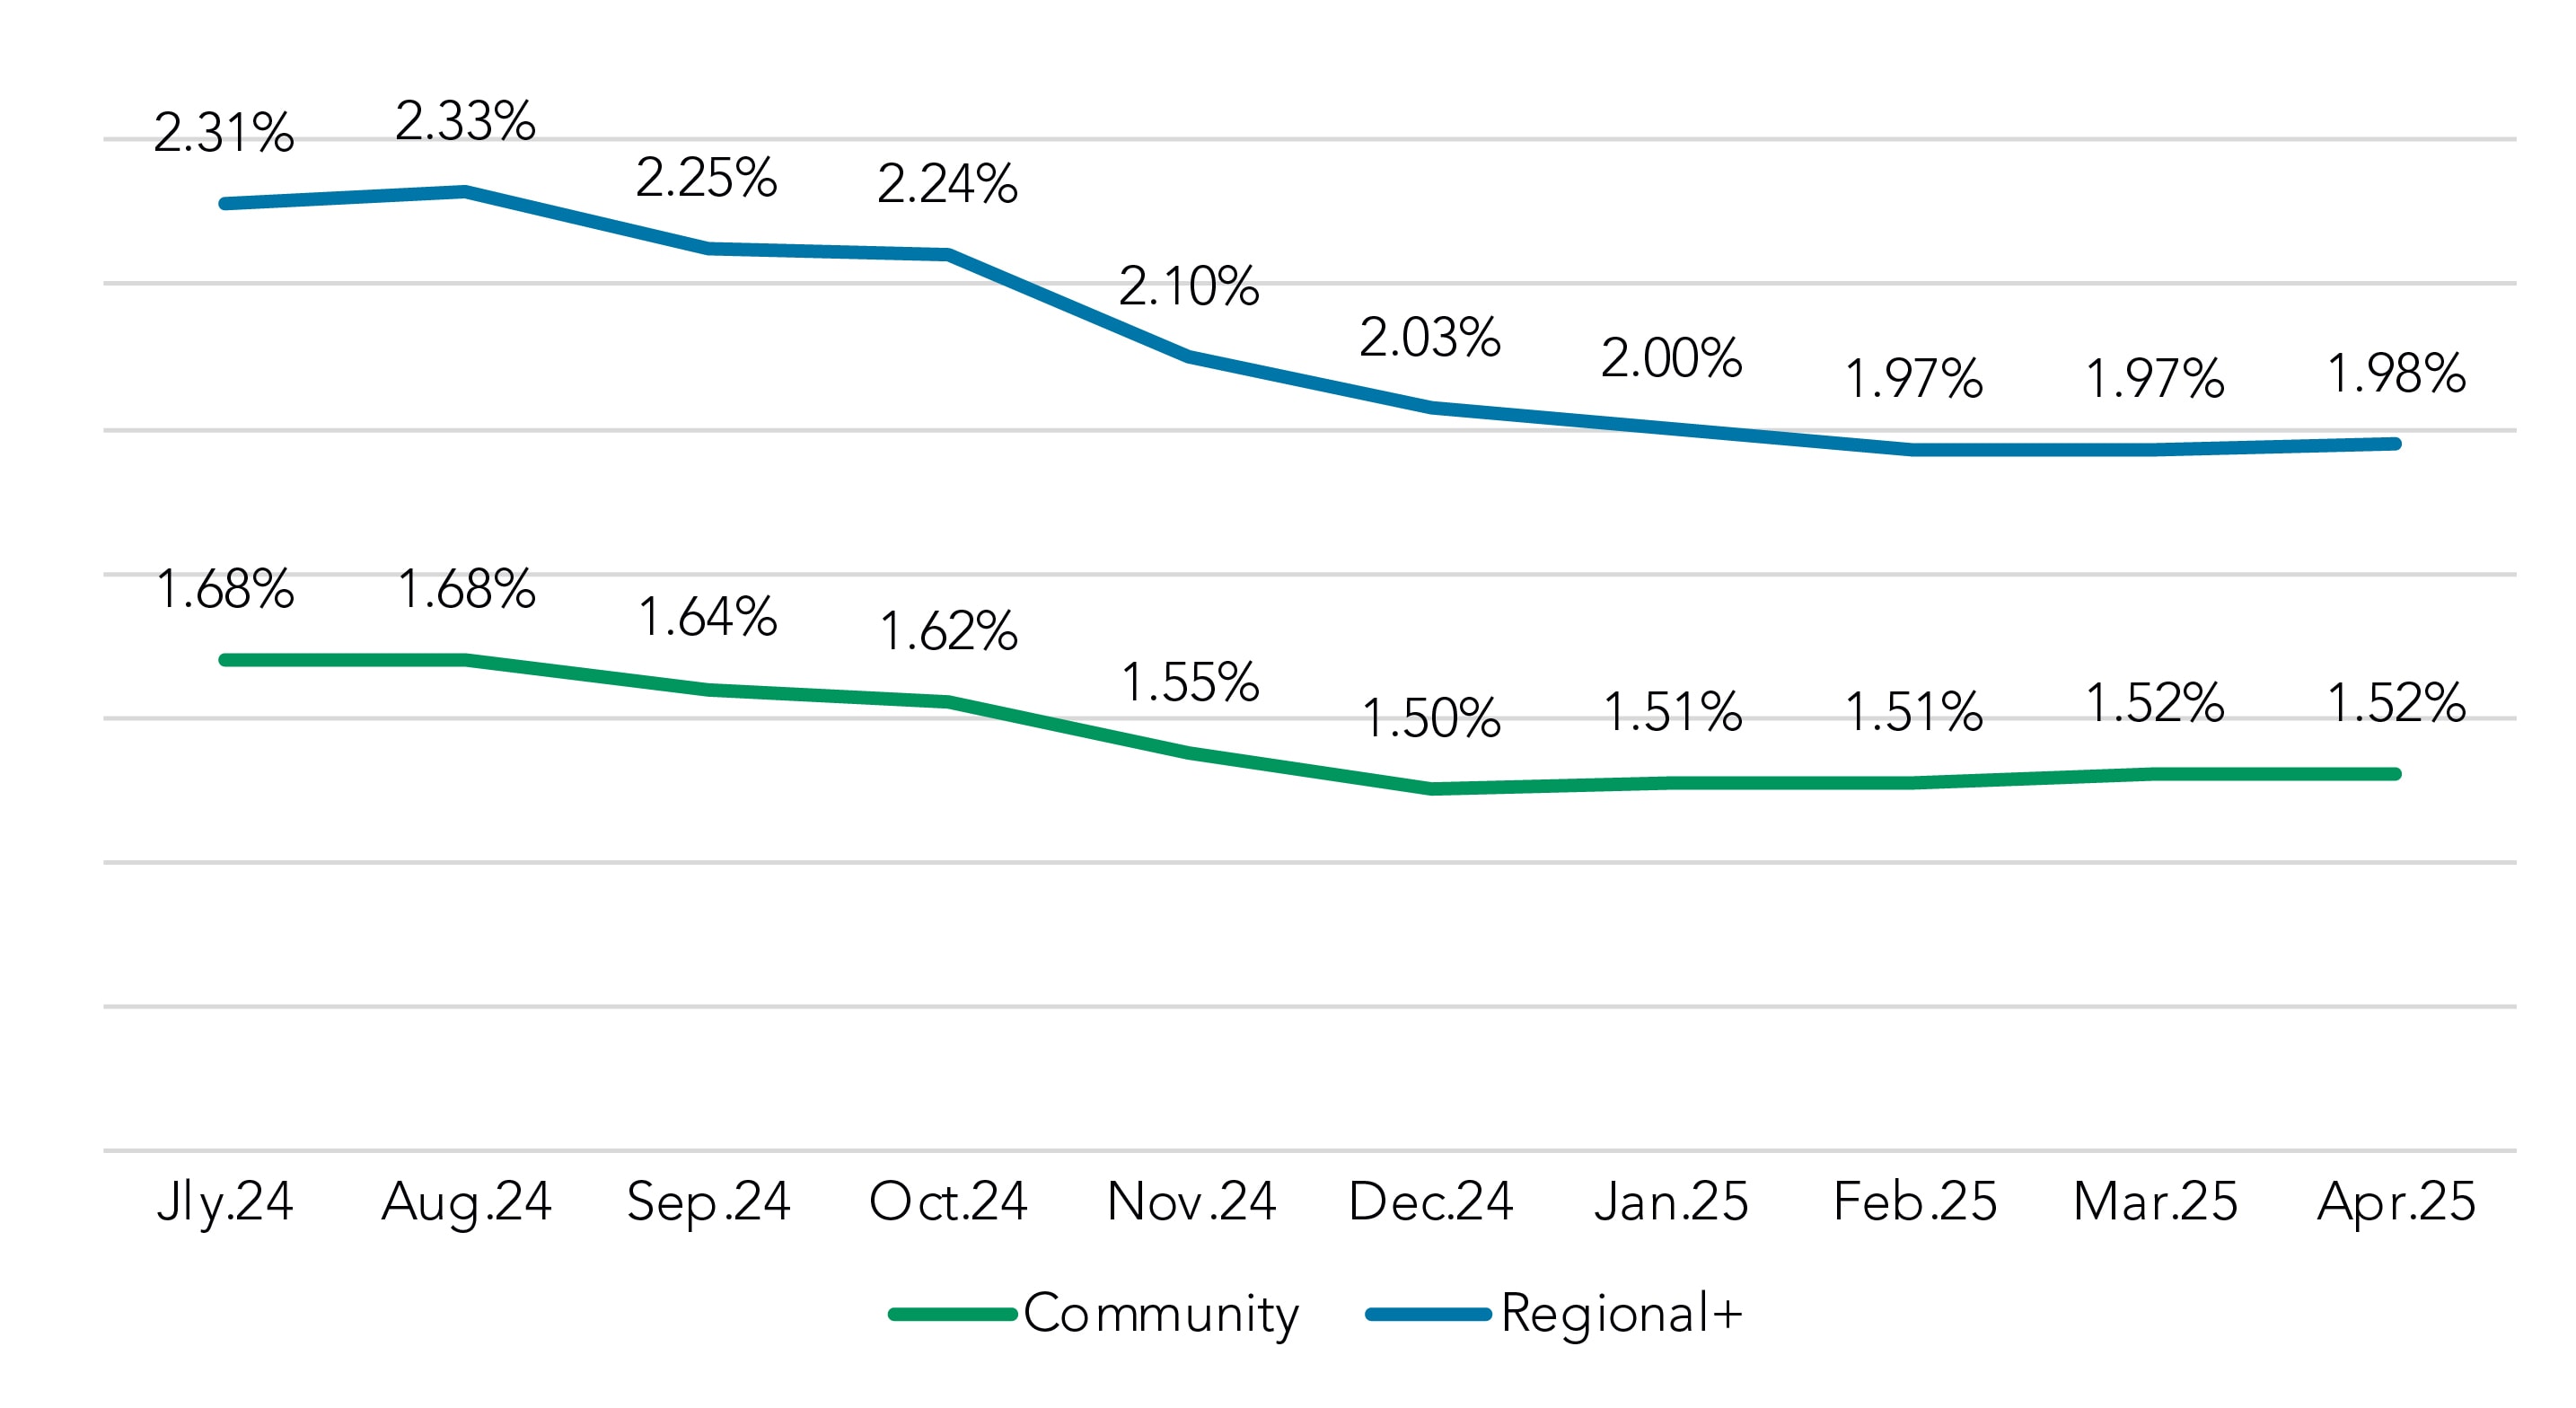
Deposit rates remain static
As noted before, the liquidity cost metrics naturally led us to inspect deposit rates again. Though the funding curves may be dropping, we found that deposit rates have moved very little in 2025.
The overall deposit rate has moved down just bps (2.00% to 1.98%) since January at Regional+ insitutions, while it’s risen a single basis point (1.51% to 1.52%) at community insitutions.
Overall Deposit Rate Paid
Includes NIB Base
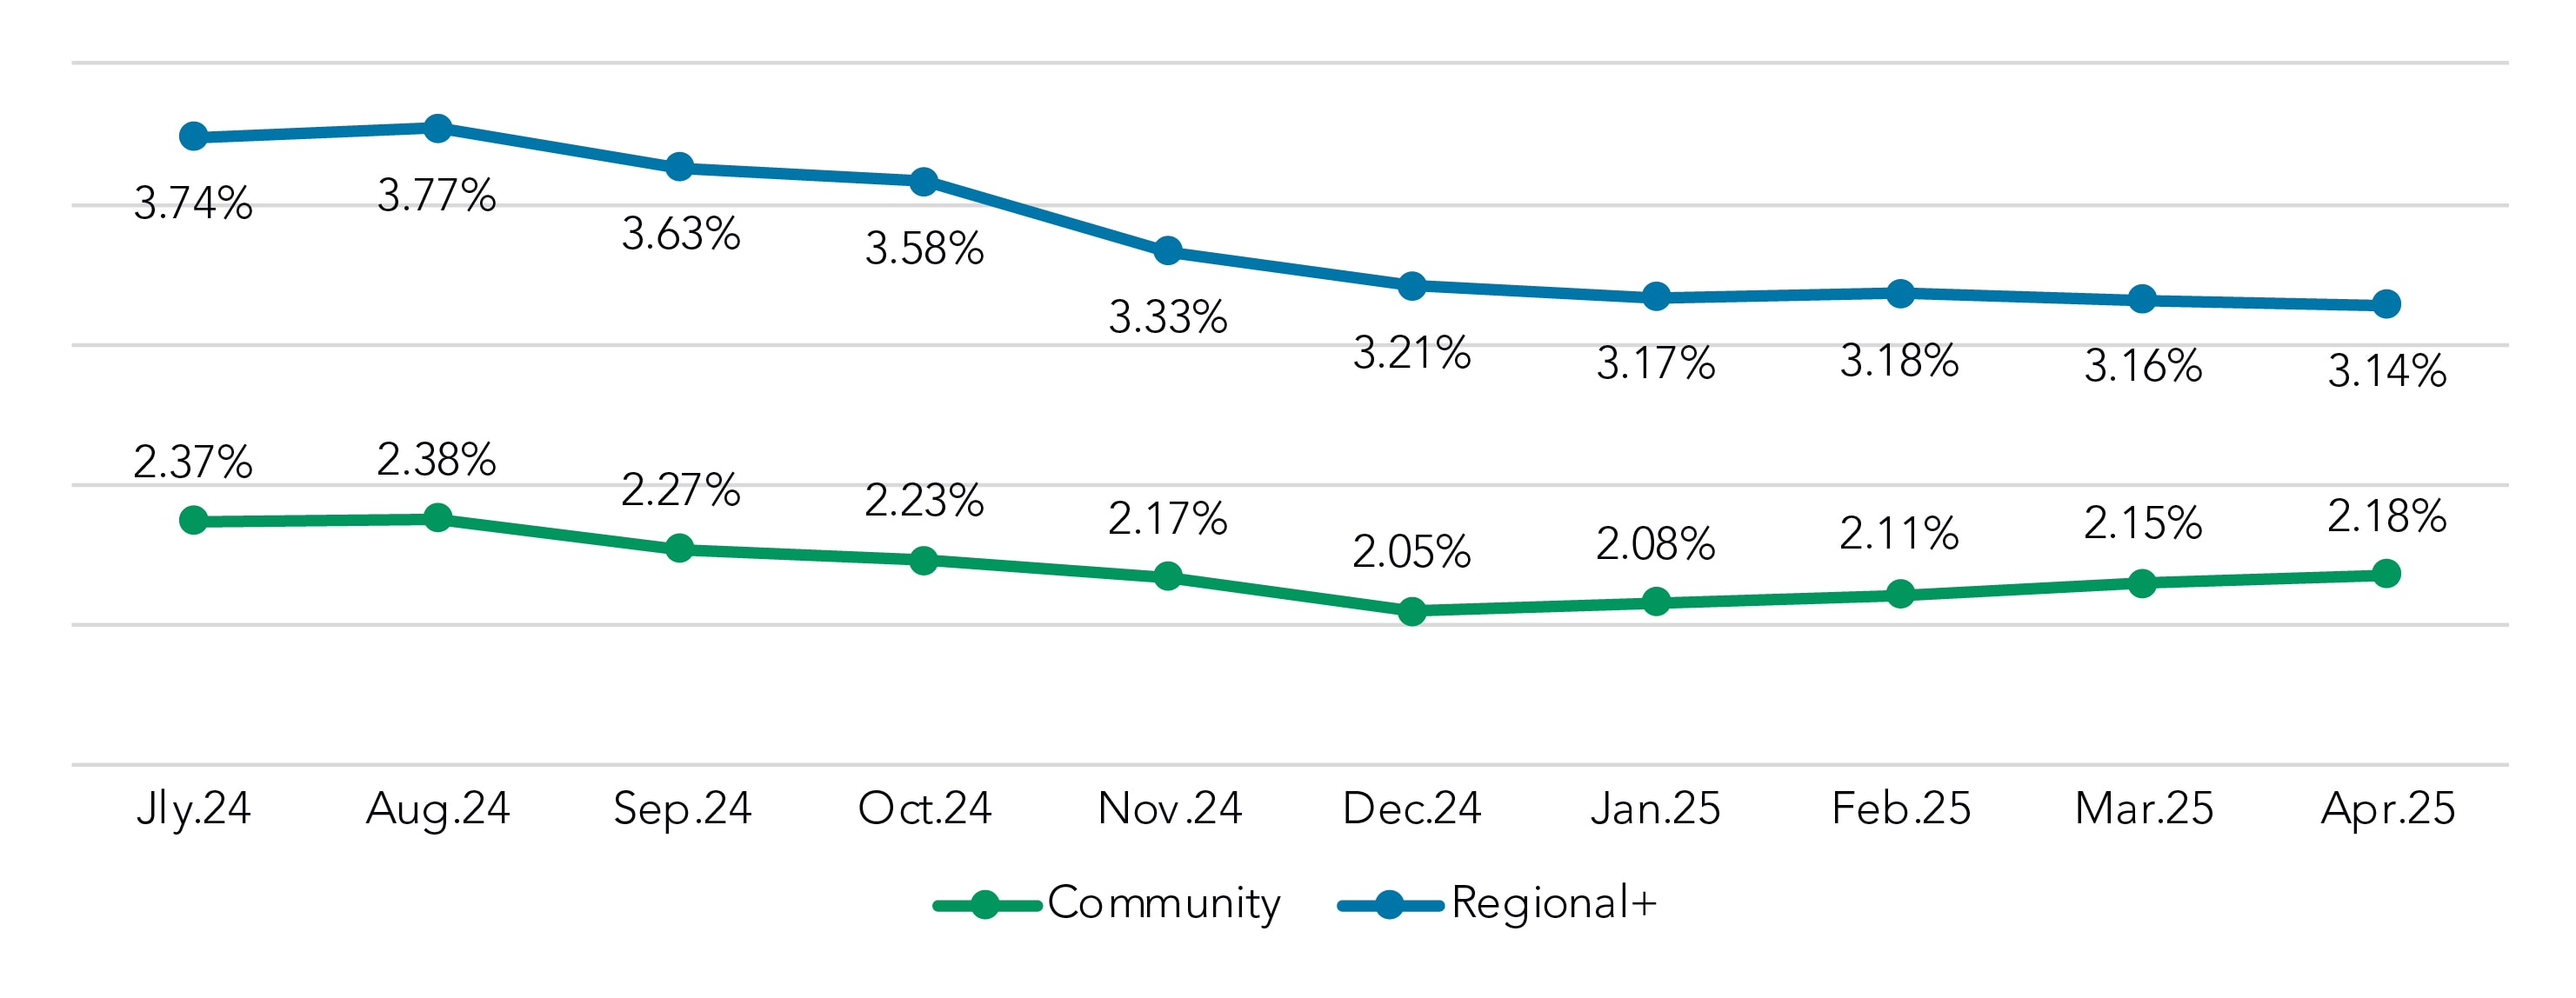
Looking specifically at the rates paid for interest-bearning non-time depostis shows that rates have actually climbed 10 bps (2.08% to 2.18%) since January at community institutions, while rates in the regional+ segment have had a modest increase of 3 bps in the same period.
The one area in which deposit rates are dropping is in CD rates, which have fallen steadily since July 2024 at both regional+ (4.68% to 4.04) and community (4.40% to 3.91%) institutions. But CDs don’t make up enough of the overall mix to alter the overall funding picture.
Interest-Bearing Non-Time (MMDA, CWI, Savings) Rate Paid
Additional context for the liquidity cost converation: Deposit balances in both segments are also virtually unchanged thus far in 2025.
Note: Deposit rate paid information is from portfolio snapshots sent from institutions throughout the month and is not a single month-end view.
Fixed-rate coupons continue to drop
The drop in COF combined with a modest increase in spreads led to a third straight month in which the fixed-rate coupon fell. After dropping by 11 bps in April (6.29% down to 6.18%), the coupon has fallen 32 basis points since reaching 6.50% in January.
Coupon Rates by Month
Rolling Trend

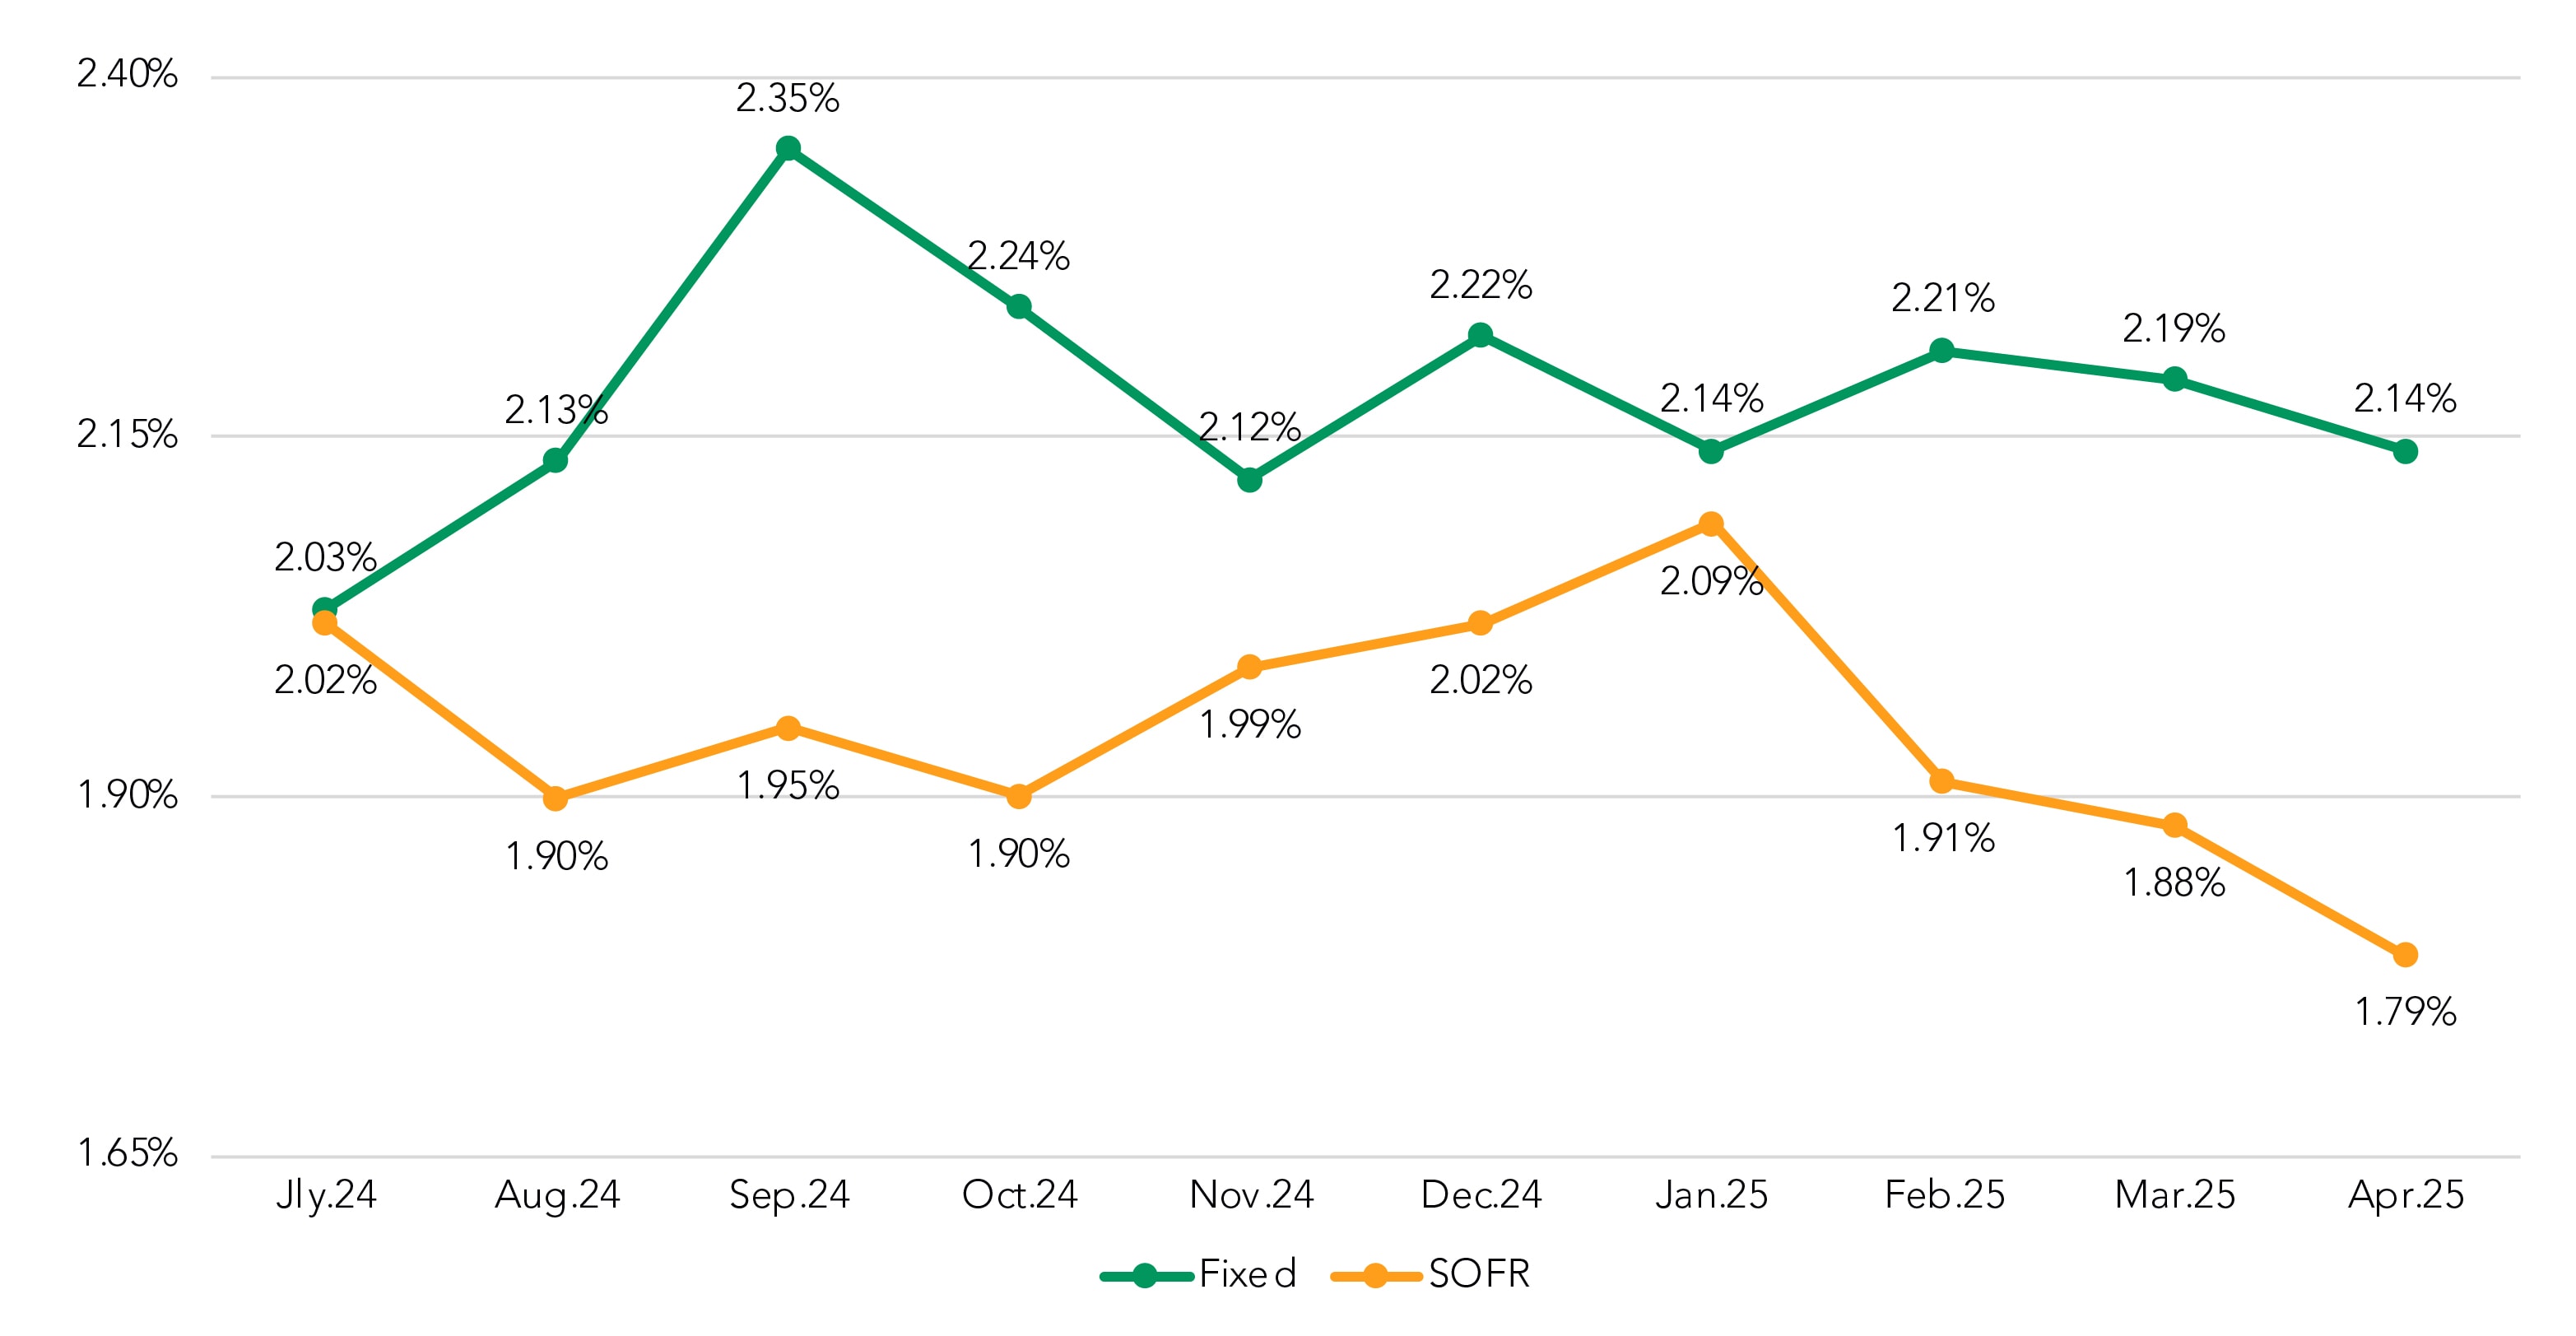
SOFR NIM continues to drop in 2025
Increased liquidity costs on top of stable base funding, along with a drop in spreads, have combined to push down net interest margin (NIM) on SOFR-based floating-rate loans by 30 bps (2.09% to 1.79%) since January.
Fixed-rate NIM has been steadier, as the drop in the fixed-rate coupon (down 32 bps since January) has essentially been offset by the drop in funding costs (down 43 bps) and an 11 bps increase in spreads (1.81% to 1.92%) during the same period.
NIM by Month
Rolling Trend
Fixed rate new/renewed vs. roll-off: The NIM gap shrinks
Finally, we checked in again on how the fixed-rate pricing on new deals in 2025 are measuring up to the pandemic-era loans that are rolling off the books this year.
In terms of volume, Q2 and Q3 2025 have greater expected roll-off amounts than Q1 and Q4. Roll-of activity to date in roughly midway through Q2 is already equal to the entirety of Q1.
The coupon in April was 6.21%, compared to 6.31% in Q1. But the rate for roll-off loans during April was 4.85%, 25 bps lower than the Q1 rate of 5.10%. Thus, the coupon delta is up 15 bps, from 121 bps in Q1 to 136 so far in April.
The roll-off NIM in Q2 is 180 bps, a lower starting point from 206 in Q1. The 26-bps shift may have been influenced by the Fed easing at the beginning of the pandemic. So far in Q2, bankers have been able to achieve a NIM (1.69%) that is 3 bps higher than Q1 (1.66%). Thus, the NIM gap, which was 40 bps in Q1, has currently shrunk to 11 bps in April.
(The parameters for this ongoing analysis are listed below the chart.)
NIM and Rates, Roll-Off vs. New
2Q25

NIM and Rates, Roll-Off vs. New
1Q 2025

Analysis Parameters
- The KPI is the degree (+/-) to which original NIM compares with NIM for new and renewed loans. It is not a record-for-record match of matured loans and their replacement attributes.
- Using the December 2024 portfolio snapshot as the basis, we’ve aggregated 2025 roll off activity by quarter and presented static coupon measures associated with each quarter. These values may change as 2025 progresses due to early payoffs, curtailments, or other activity.
- We also used the December 2024 snapshot to capture the expected /implied interest rate shock for each quarter in 2025. This estimate may change as 2025 progresses: the expected rate shock now for 4Q25 will likely not be same then as it is today. Rate shock is an estimation of how much additional interest expense borrowers could face if they refinance their loans rolling off in 2025 at current market rates.
- Note that the roll-on coupon and NIM are different than the overall fixed-rate pricing metrics. We attribute this variance to different data sources and timing.
Got questions?
Our banking consultants and data scientists are combing through Q2 PrecisionLender pricing data every day. If there is anything you’d like to know about what they’re seeing, please send your questions to insights@q2.com.
Sign up to receive our market update each month