Commercial Loan and Deposit Pricing Market Update: September 2024
The subject matter for this month’s update will center around the sharp drop in market rates in early August and the impact that has had on fixed-rate loan pricing, as well as deposit pricing.
We will also take a closer look at what may be a developing trend in SOFR-based floating-rate spreads.
Read on to get more details.
Data Notes:
• This market update is based on the previous month’s (August 2024) data in the Q2 PrecisionLender database.
• Q2 PrecisionLender uses an assumed marginal duration matched funding cost, not the bank’s actual average cost of funds, when referring to the Cost of Funds (COF) on loan pricing activity.
• We define Regional+ as institutions with $8B+ in assets, while Community are <$8B.
Pricing volume remained high
August pricing volume was up from July, and above the YTD average. This marks the second straight increase after the month-over-month drop in June.
Priced Commercial Loan Volume in $
Indexed to January 2024 = 100

Market rates fell sharply
The start of August brought with it a sharp drop in market rates, likely in response to the July jobs report, which fueled speculation on near-term Fed rate cuts. This is shown by the FHLB, SOFR, and Treasury rates below, using the 60-month term rate, a proxy for fixed-rated funding. The drop of ~ 50 basis points was noted across tenors of 3 months or longer and brought on a reduction in coupon rates on loans. (More on that below.)
July-August 60-Month Term
Selected Curves

Funding curve trough deepened
Looking more closely at the FHLB funding curve, we can see how much the early August rate decrease increased the degree of inversion. In our snapshot at the end of May the rate drop from 1-month to 60-month was 78 bps. It was 160 bps in our August 31 snapshot.
Where previously the 3-month rate was essentially the same as the 1-month, it’s now 21 basis points lower, and the 12-month rate fell 39 basis points as the inversion trough continues to both deepen and widen.
FHLB Curve
Selected Dates

Liquidity costs adjustments continued
Given the market rate decreases, it’s not surprising that pricing managers are keeping an eye on their liquidity costs. While fixed liquidity costs fell slightly in August, they are still up 13 bps since April. Meanwhile, floating liquidity costs are up 10 bps since June and are at their highest point of the last 12 months.
Approximate Liquidity Cost
Rolling Trend

All-In COF: Fixed drops, SOFR steady
For SOFR-based floating rate loans, the liquidity cost increase served to counterbalance a slight drop in the market rates and kept all-in COF steady, continuing the trend throughout 2024.
Meanwhile the fixed-rate all-in COF essentially mirrored the market rates, falling 52 basis points in August down to 4.27%.
All-In COF By Month
Rolling Trend

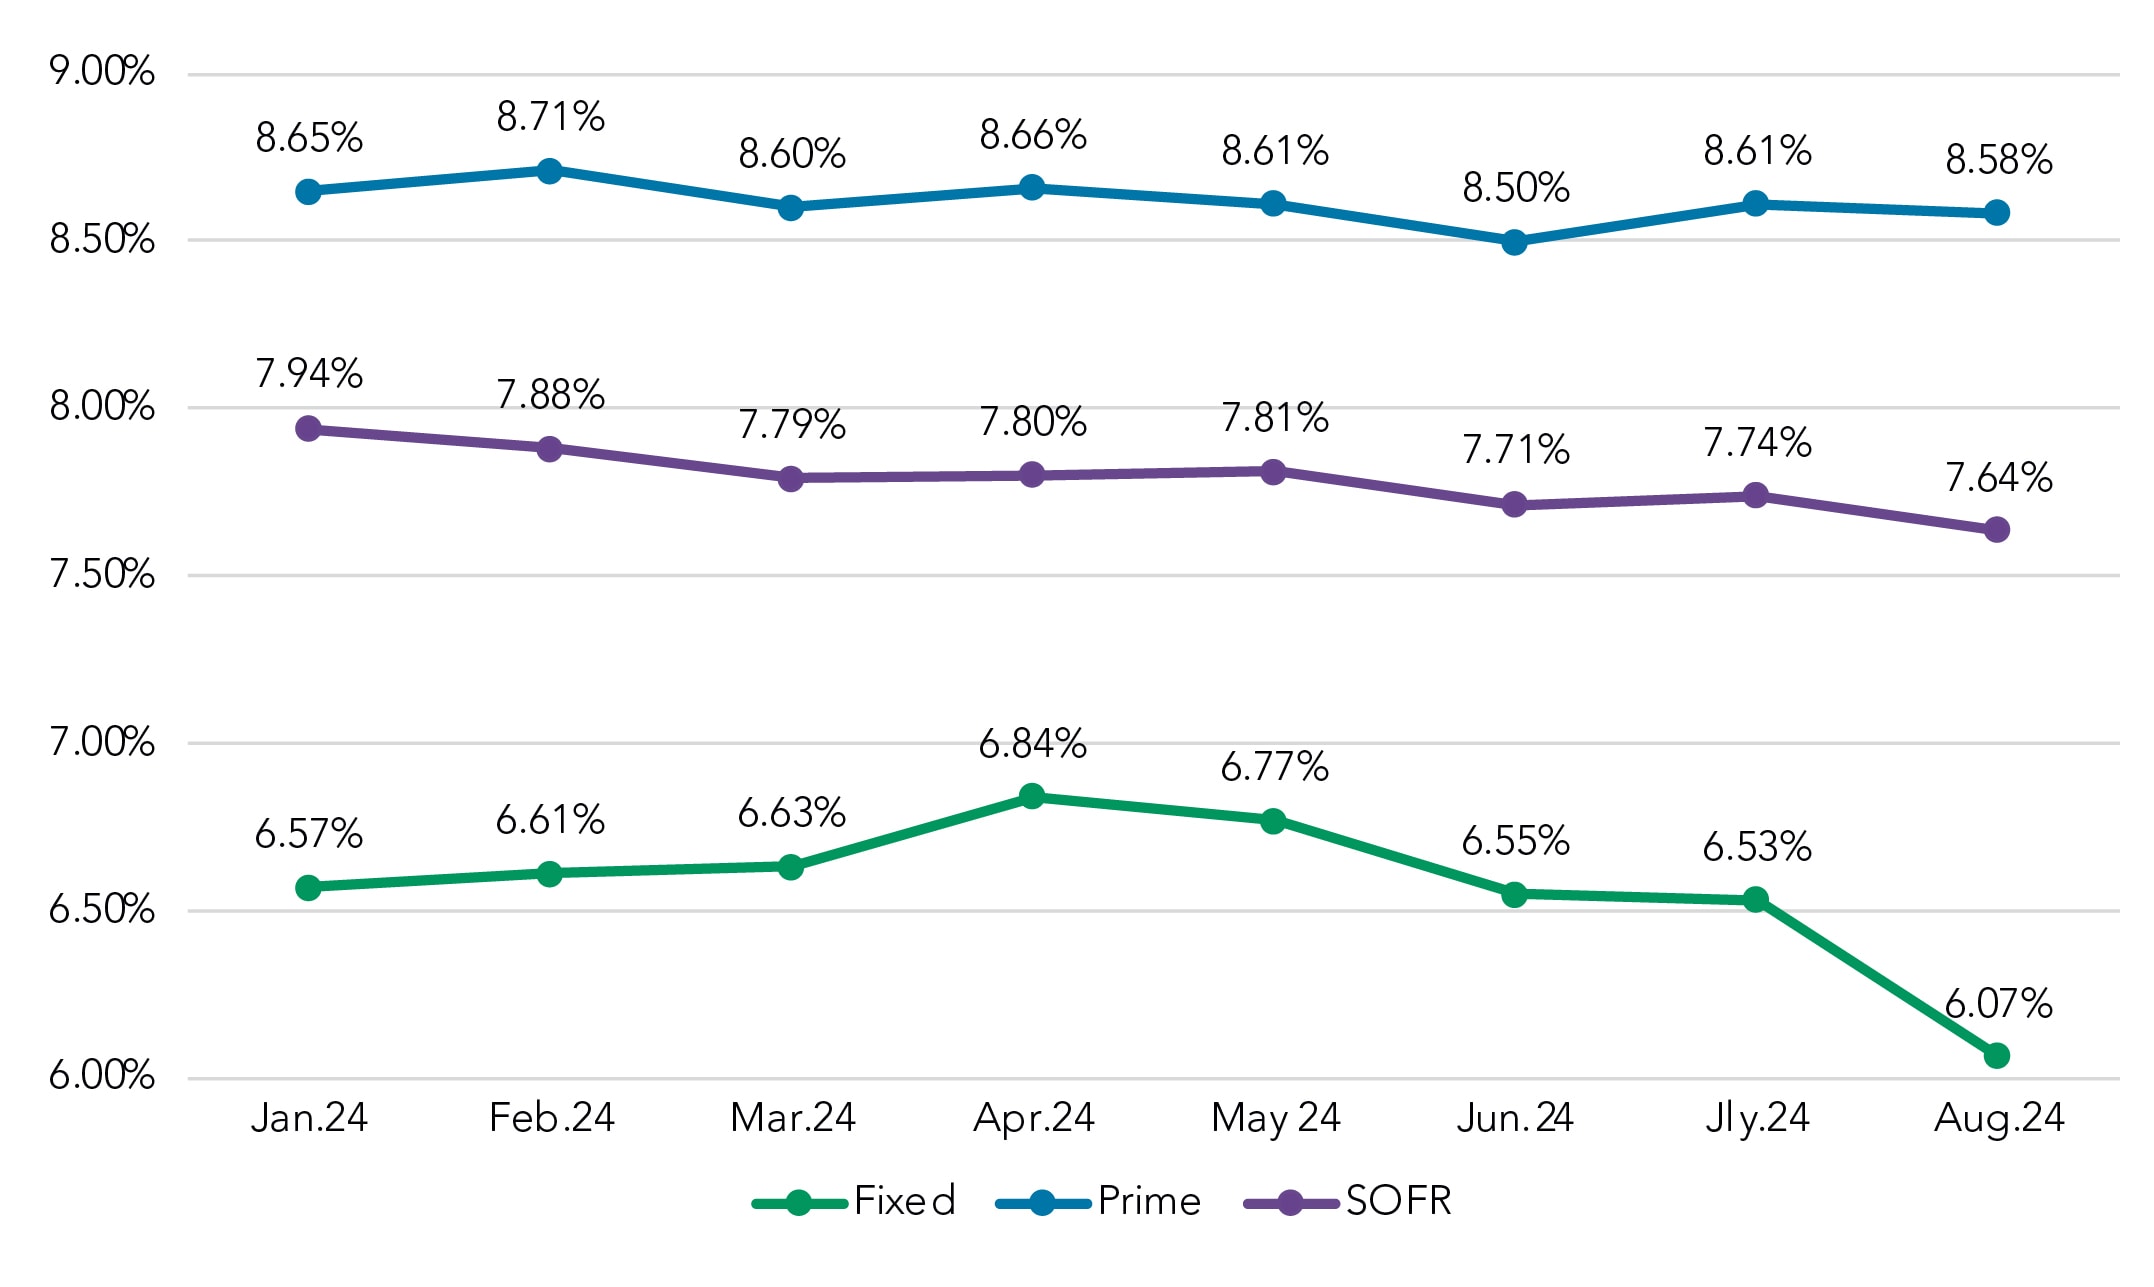
Coupons fall across the board, to varying degrees
Coupon rates, the top-line revenue metric for commercial loan pricing, fell for all three structure types. For fixed-rate loans, the drop in funding costs was largely passed directly on to the borrower, thanks to a 46-basis point drop in the coupon rate in August.
Floating rate coupons loans also fell, with Prime coupons dropping by 3 bps and SOFR coupons dropping 10 bps. (More on SOFR spread below).
The revenue gap between floating- and fixed-rate loans widened considerably. Fixed-rate coupons are now 157 bps lower on average than SOFR-based floating-rate coupons. The difference between the two coupons has expanded from 96 bps in April.
Coupon Rate by Month,
Rolling Trend
Spreads: Slight gain for fixed, continued slide for SOFR
Though we noted that bankers passed nearly all of the drop in fixed-rate funding costs onto the borrower, they were still able to manage a 6 bps increase in spreads in August. Since reaching a YTD low in June, fixed-rate spreads have rebouned by 10 bps over the past two months. Still, fixed-rate spreads are down 17 bps since the start of 2024, likekly in part because of anticipated fed rate cuts.
Fixed-Rate Spread

Meanwhile, spreads to SOFR are trending in the opposite direction. Despite steady funding costs, SOFR-based coupons fell in August, primarily due to a 6 bps drop in spread. The weighted average spread to SOFR in August was a YTD low, down 15 bps from May and 27 bps since January.
Spreads to Prime fell 2 bps in August (down to 0.10%) but have at least rebounded after dropping down to just 0.01% in June.
While a line can be drawn from anticipated rate cuts to lower fixed-rate coupons, the underlying causes of the SOFR spread drop are less clear – as the corresponding index values have been largely unchanged.
Weighted Average Spread to SOFR

NIM: Fixed improves, SOFR declines
The spread increases for fixed-rate loans played a part in helping bankers “keep” a share of the market rate change in their pricing, leading to an 11 bps increase in fixed-rate NIM in August, to 2.13%.
Meanwhile, SOFR NIM fell by 13 bps, down to 1.90%. It has fallen 33 bps since the start of 2024.
It’s worth noting though, that while fixed-rate NIM is outpacing SOFR NIM, it’s a higher margin on a lower level of revenue, as noted in the coupon rate chart.
NIM by Month
Rolling Trend

The Segment View
Because of the large movements in market rates in August, we wanted to also examine revenue measures by segment. Community and Regional+ institutions made equivalent moves in fixed-rate pricing, dropping their coupons by 49 and 47 basis points respectively.
Fixed-Rate Coupon

The two segments diverged slightly on SOFR pricing, with community institutions holding on to spreads at 2.99% while regional+ spreads dropped by 7 bps, down to 2.31%
Meanwhile, spreads to prime fell 4 bps (from 0.33 to 0.29%) at community institutions and went down from 0.01% to 0.00% for regional+ institutions.
Spread to SOFR

Deposit rates remain steady
Finally, we checked in with deposit rates to see if, like loan coupons, bankers had lowered them in anticipation of future rate cuts. Not yet.
Overall, deposits rates rose by .02% at Regional+ institutions and stayed static at community institutions. Interest-bearing non-time rates stayed static as well. CDs were also steady, 4.66% for regional+ and 4.40% for community.
Note: Deposit rate paid information is from portfolio snapshots sent from institutions throughout the month and is not a single month-end view.
Overall Deposit Rate Paid
Includes NIB Base

Interest-Bearing Non-Time, Rate Paid
(MMDA, CWI, Savings)

Got questions?
Our banking consultants and data scientists are combing through Q2 PrecisionLender pricing data every day. If there is anything you’d like to know about what they’re seeing, please send your questions to insights@q2.com.