Commercial Loan and Deposit Pricing Market Update: October 2024
In our latest analysis of the Q2 PrecisionLender commercial loan and deposit pricing database, we e-examined how the commercial market responded to the mid-September Fed rate cut.
In particular, we looked at the factors behind an improving NIM for fixed-rate loans, and how floating-rate loans are being priced after their first drop in funding costs this year. We also checked in how deposit rates responded to the changing market conditions.
Read on to get more details.
Data notes:
• This market update is based on the previous month’s (September 2024) data in the Q2 PrecisionLender database.
• Q2 PrecisionLender uses an assumed marginal duration matched funding cost, not the bank’s actual average cost of funds, when referring to the Cost of Funds (COF) on loan pricing activity.
• We define Regional+ as institutions with $8B+ in assets, while Community are <$8B.
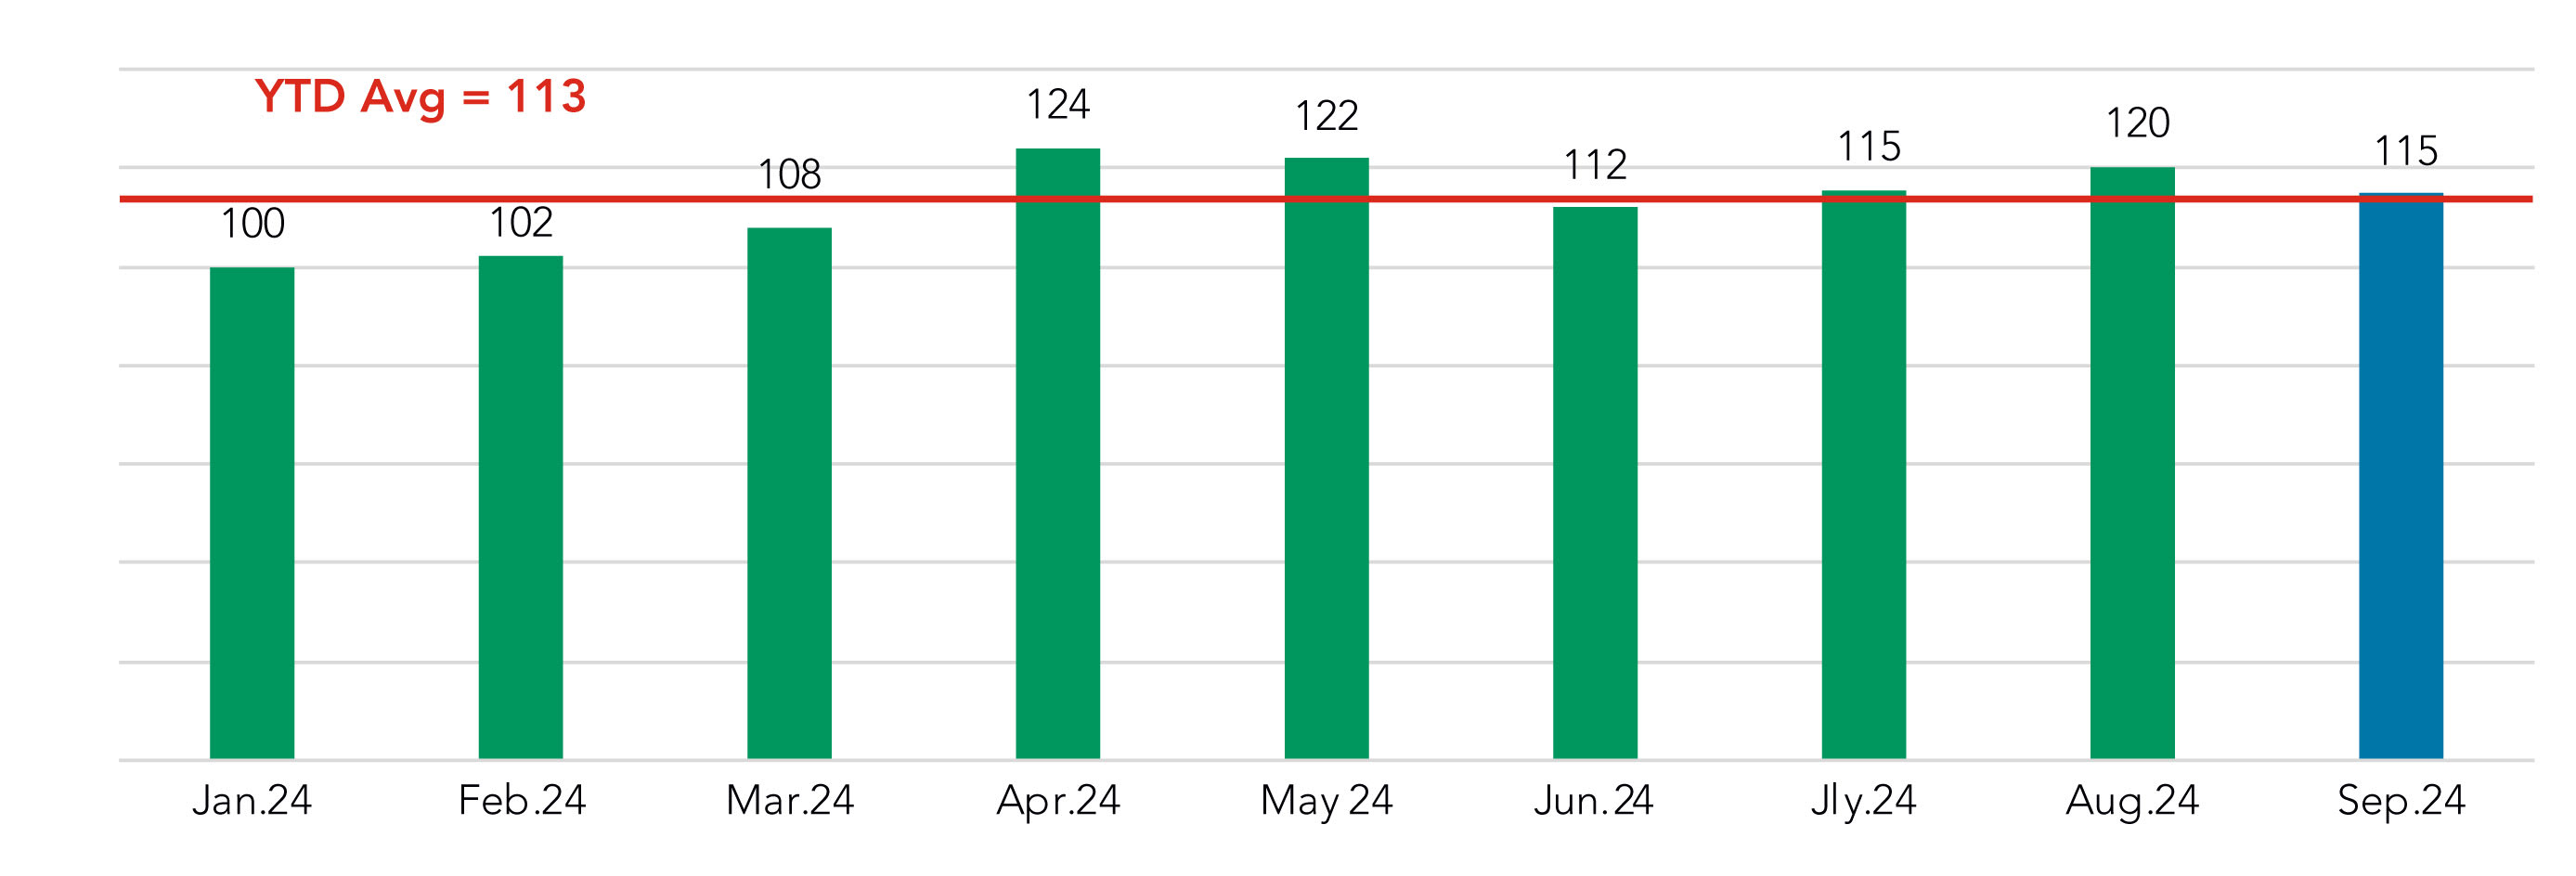
Pricing volume drops slightly
While the volume of opportunities priced in September was down, month over month, it was still slightly above the YTD average. After the upswing in volume in the first four months of 2024, the monthly totals have oscillated back and forth slightly, but with no signs so far of contraction.
Priced Commercial Loan Volume in $
Indexed to January 2024 = 100
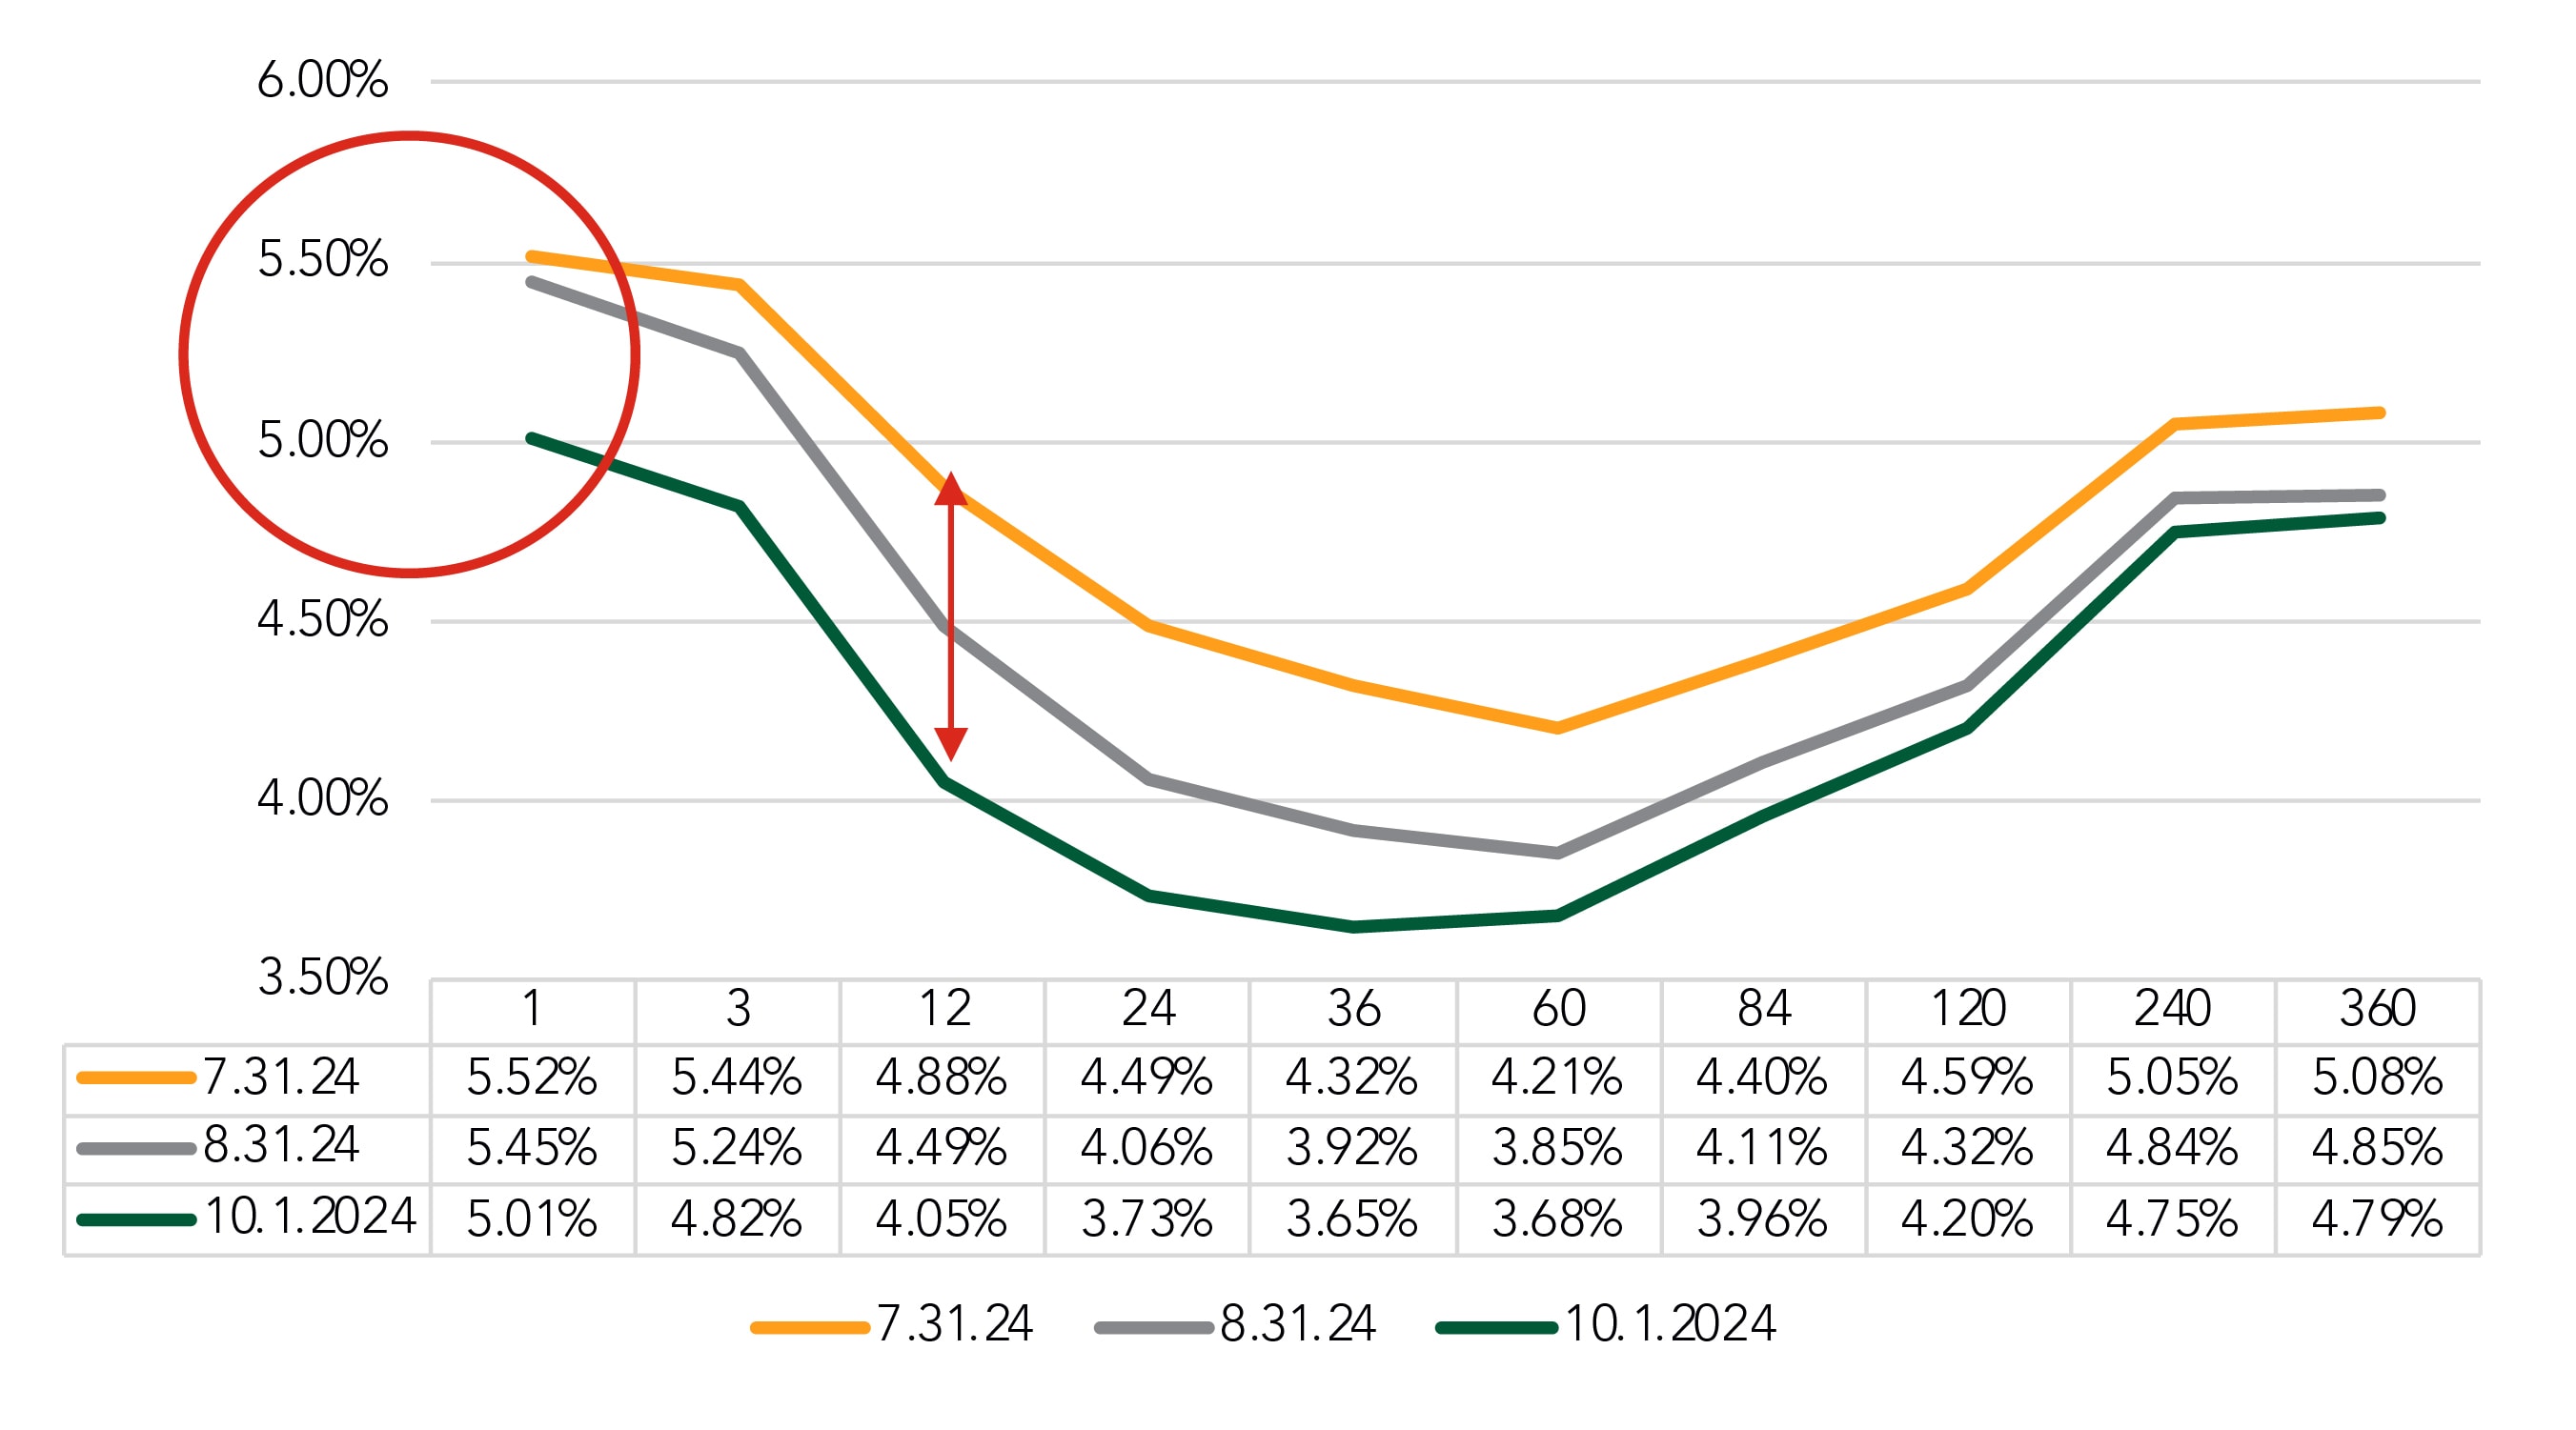
FHLB curve inversion shallows but widens
After remaining virtually unchanged for all of 2024, the FHLB 1-mnth rate made its first significant move of the year, dropping 44 basis points (from the Aug. 31 snapshot to the Oct. 1 snapshot) in the wake of the mid-month fed rate cut.
That drop meant the curve shallowed, as the 60-month point fell 17 bps during the same period. This reduced the negative FHLB 1- to 60-month carry to -1.33%, from 1.60% the previous month. We have been tracking the inversion from 1 to 60 months because these are the primary reference points for floating- and fixed-rate loan funding.
However, while the trough hasn’t gotten deeper, it has grown wider, with the 12-month rate dropping 83 bps since the end of July —39 bps in August and 44 more in September.
FHLB Curve
Selected Dates
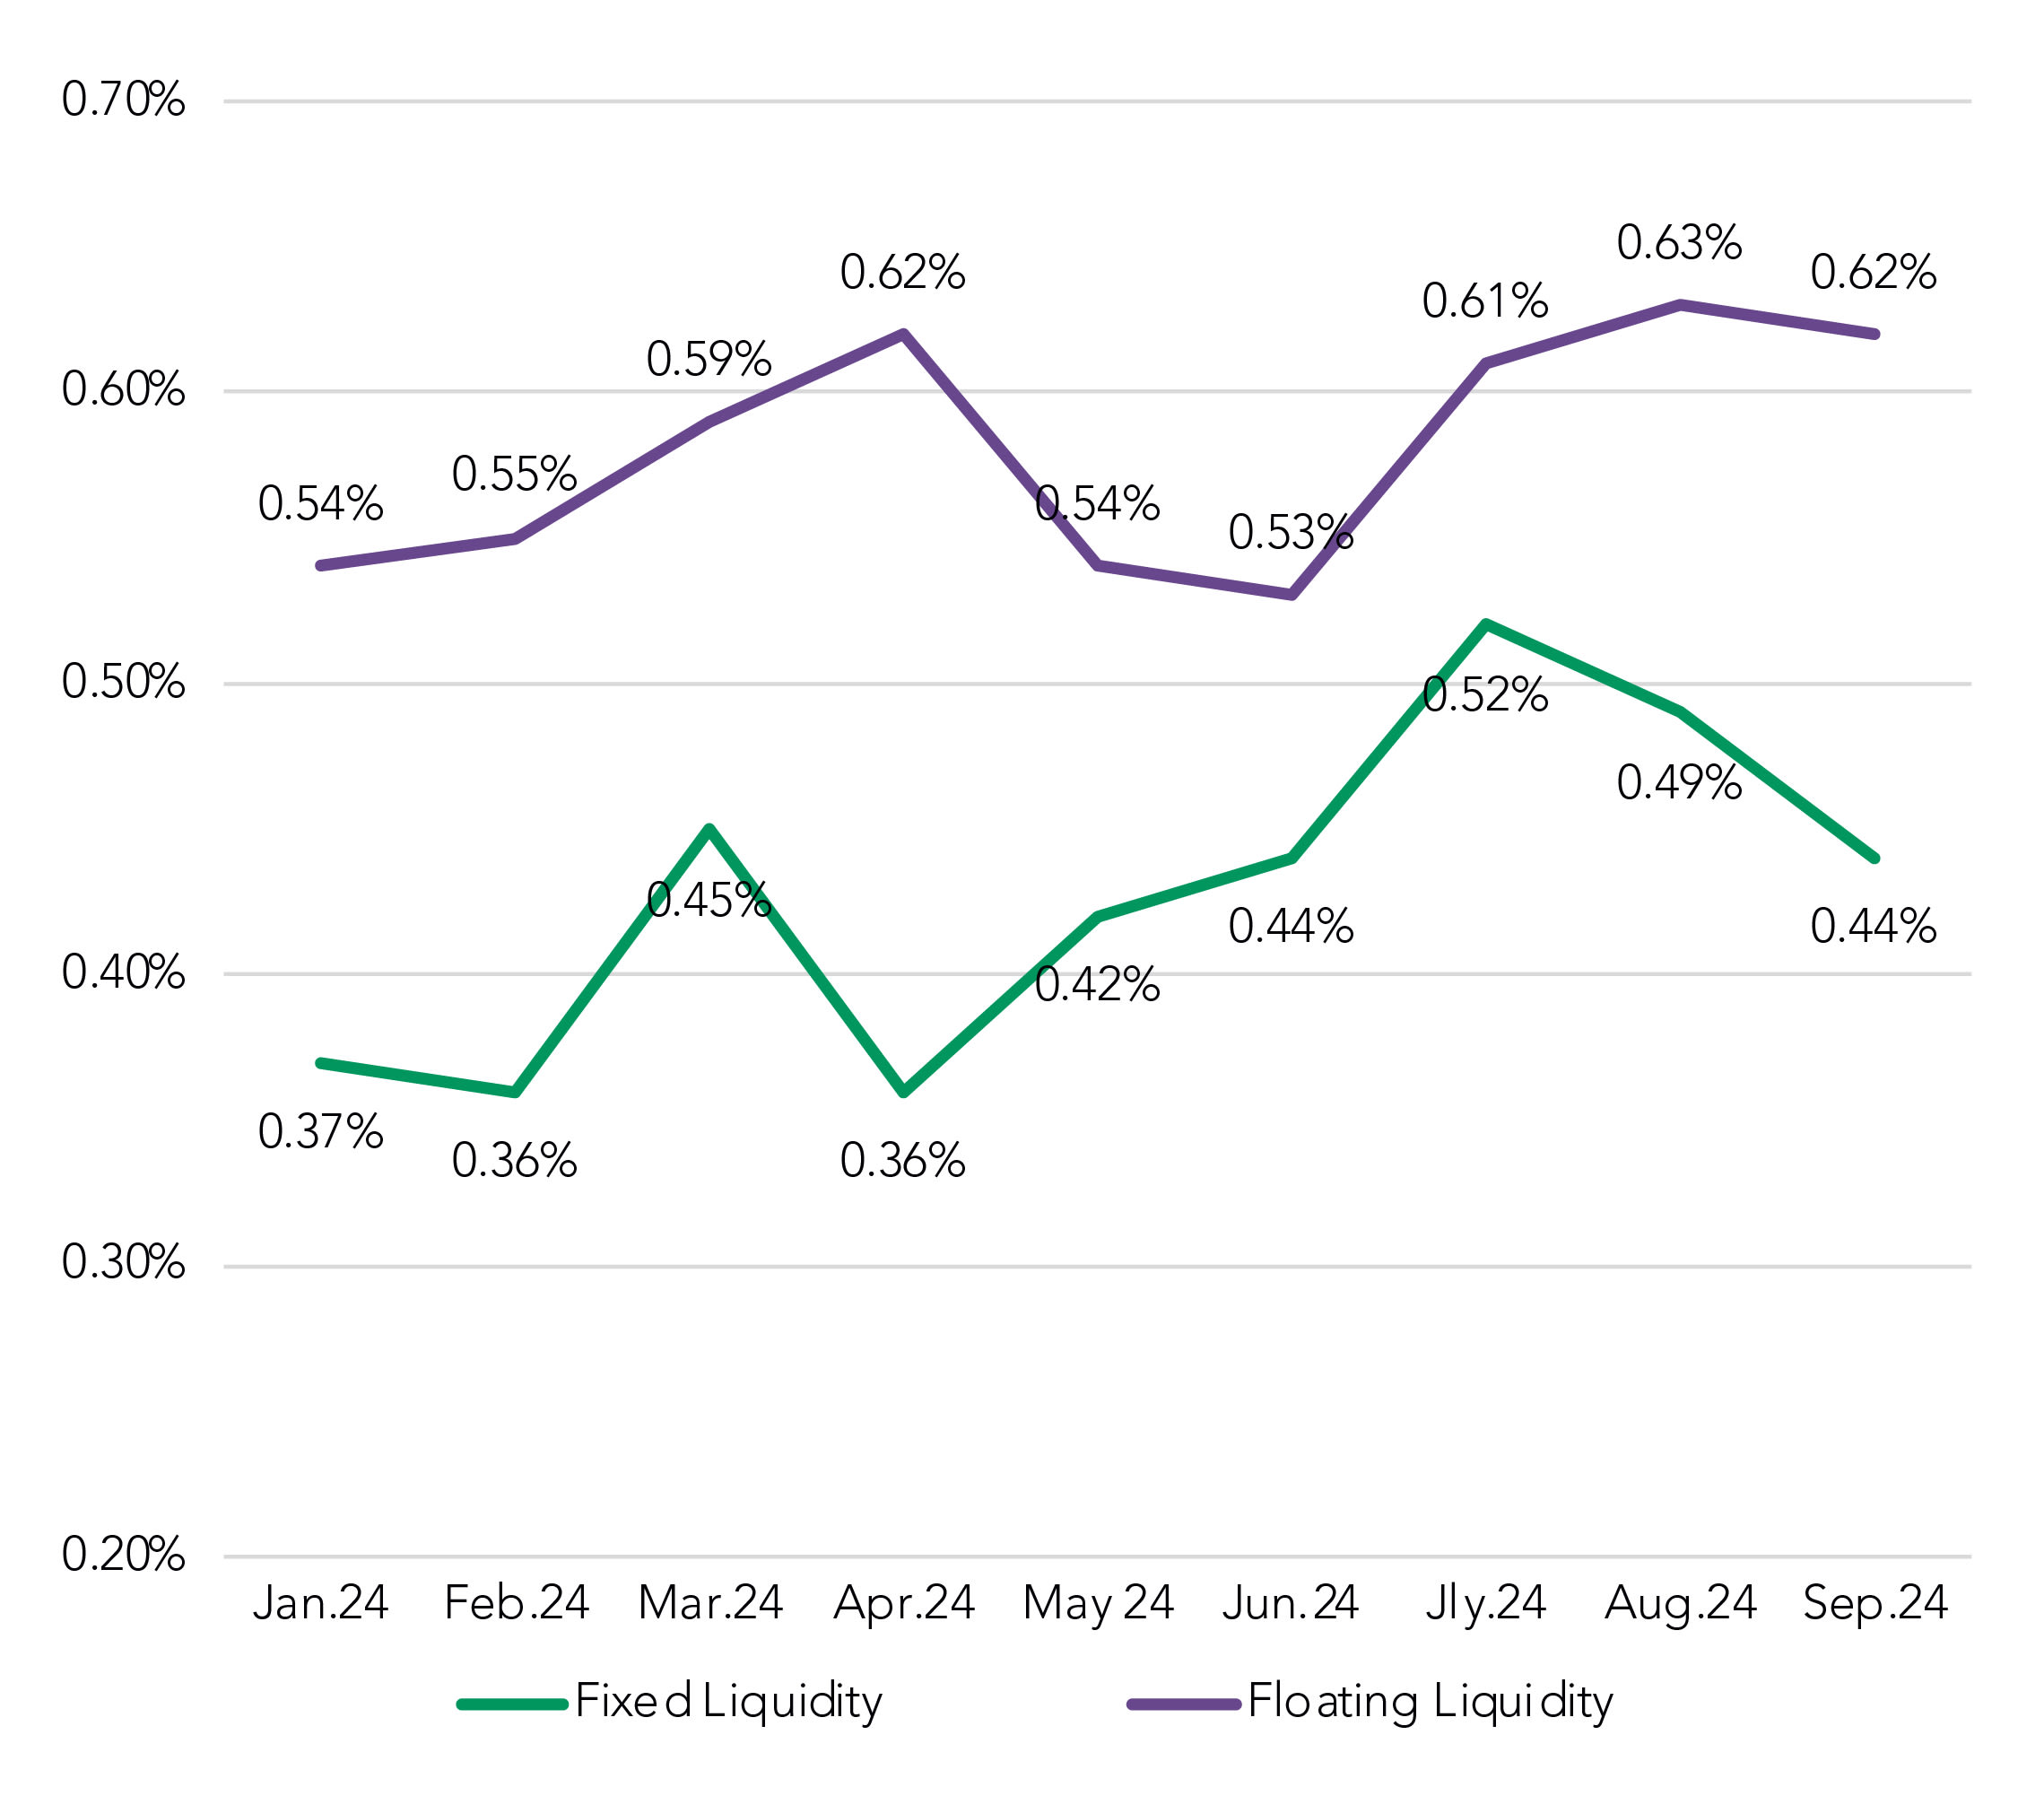
Did the rate drop impact liquidity costs?
While the FHLB curve dropped on both sides of the rate cut, we were curious to see whether deposit rates dropped (we’ll address that later) and whether pricing managers made any adjustments to their liquidity costs as well.
Floating-rate liquidity costs have remained relatively unchanged after rising earlier this summer. Fixed-rate liquidity costs, though, fell for the second straight month and have dropped 8 bps during that time span.
We have had some questions around the maturity points represented by the fixed- and floating-rate liquidity costs. Floating rate loans have an approximate average maturity of 39 months, while fixed-rate loan average maturities are in the 66-72 month range.
Approximate Liquidity Cost
Rolling Trend
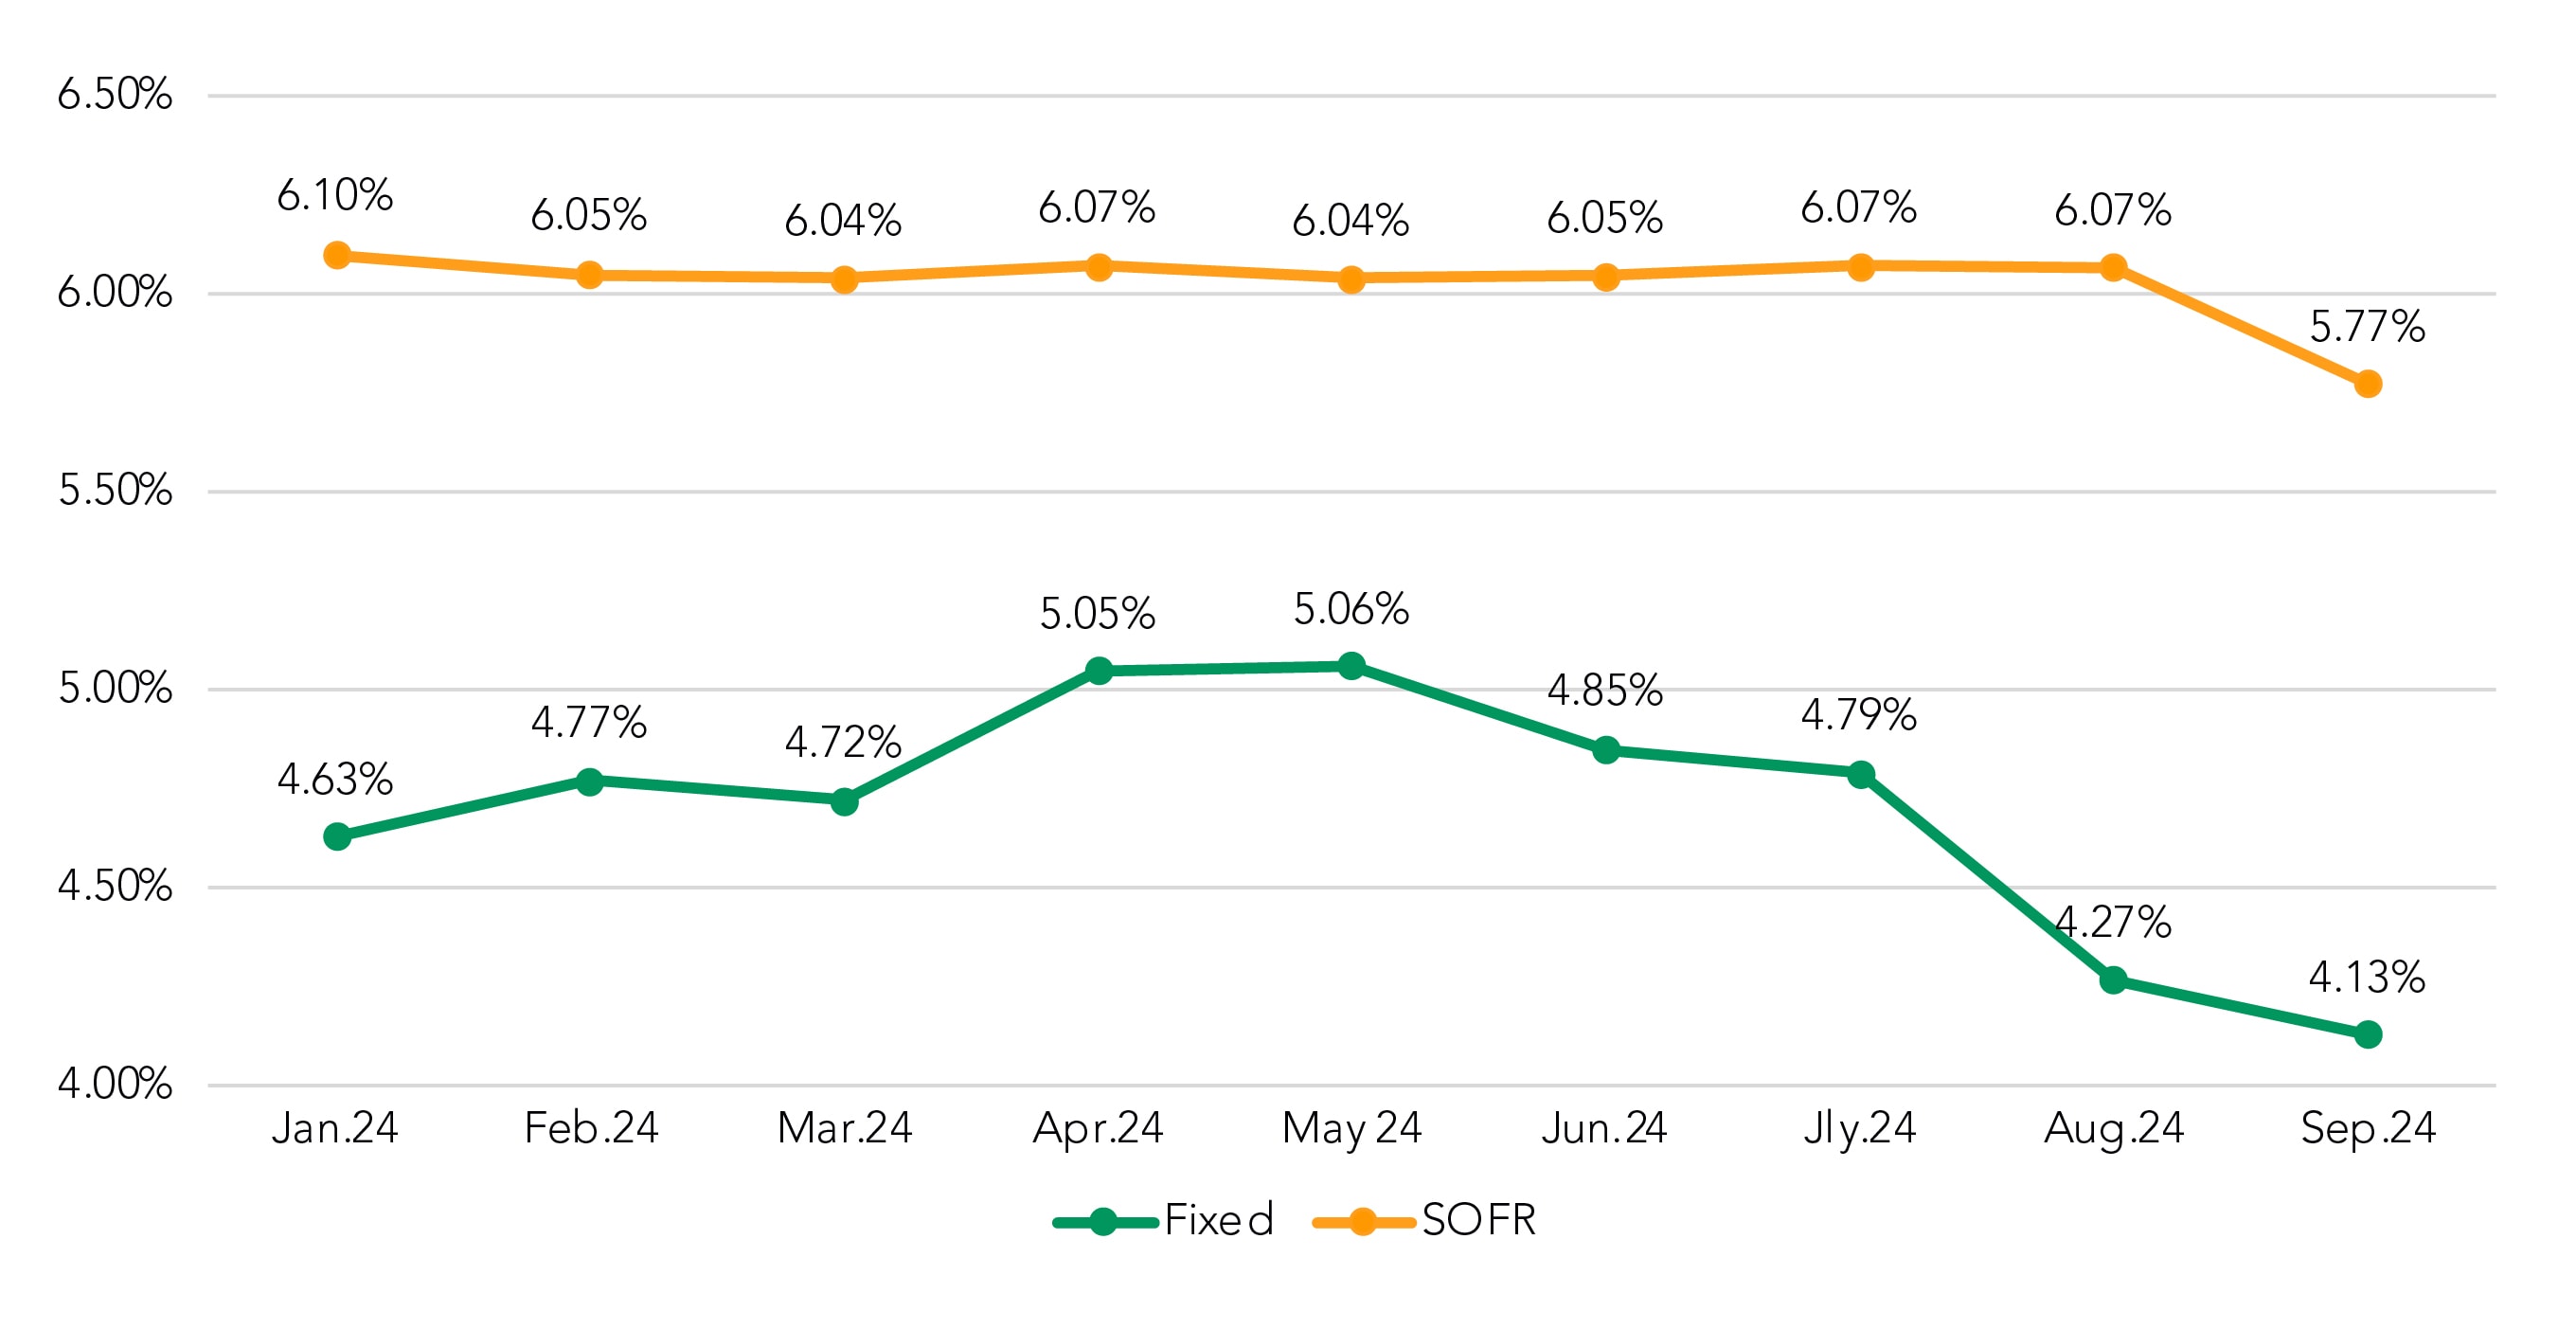
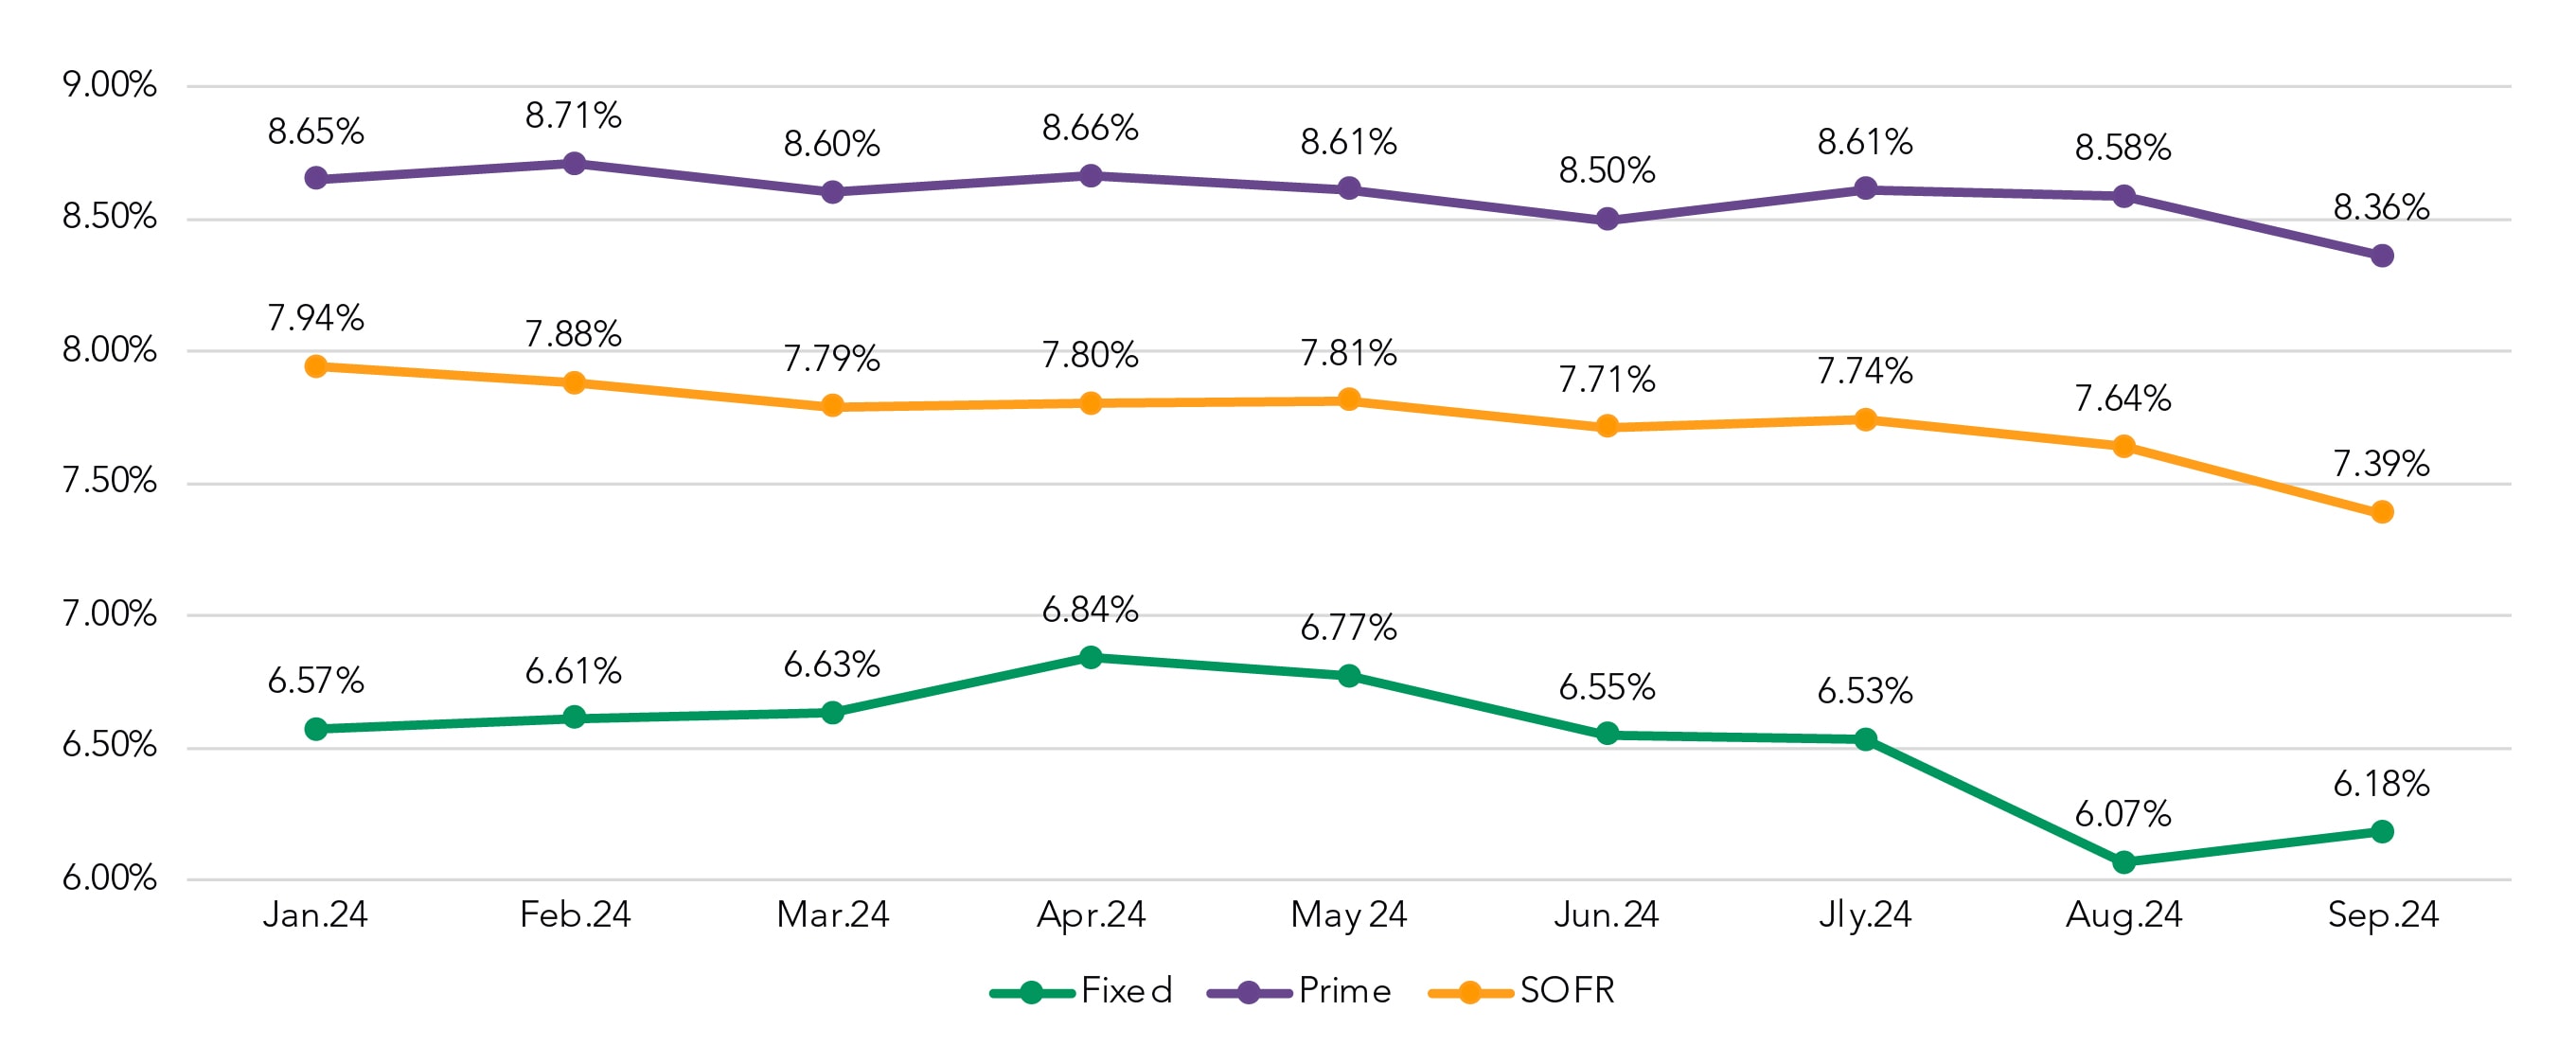
All-In COF falls for floating-rate loans
Though floating-rate liquidity costs remained higher, all-in COF for floating-rate loans fell significantly for the first time in 2024, dropping 30 bps from 6.07 to 5.77%. This decrease was driven by the 50 bps drop in the SOFR index.
Meanwhile, fixed-rate funding costs continued their downward trend. Since peaking at 5.06% in May, All-In COF has fallen 93 bps during that span, including 14 bps (4.27% to 4.13%) from August to September.
All-In COF By Month
Rolling Trend
Fixed-rate spreads continue to rise
In August, fixed-rate spreads rose only a small amount, as the coupon moved in lockstep with falling funding costs. In September, though, bankers were able to keep the coupon higher (more on that below) and as a result, produced a 28 bps increase in spread.
Fixed-Rate Coupon Over COF Rate
It was a very different story for floating-rate spreads, as neither the weighted average Spread to SOFR (2.36%) nor the weighted average spread to Prime (0.10%) moved from August to September.
Weighted Average Spread to SOFR
Fixed-rate coupon rises
As previously noted, fixed-rate coupons moved in the opposite direction of funding costs in September, rising by 11 bps (6.07% to 6.18%) to contribute to the jump up in spread.
Floating-rate coupons for both SOFR and Prime dropped (25 bps for SOFR and 52 bps for Prime), negating any potential spread gains that might have come from the rate decrease.
Coupon Rate by Month
Rolling Trend
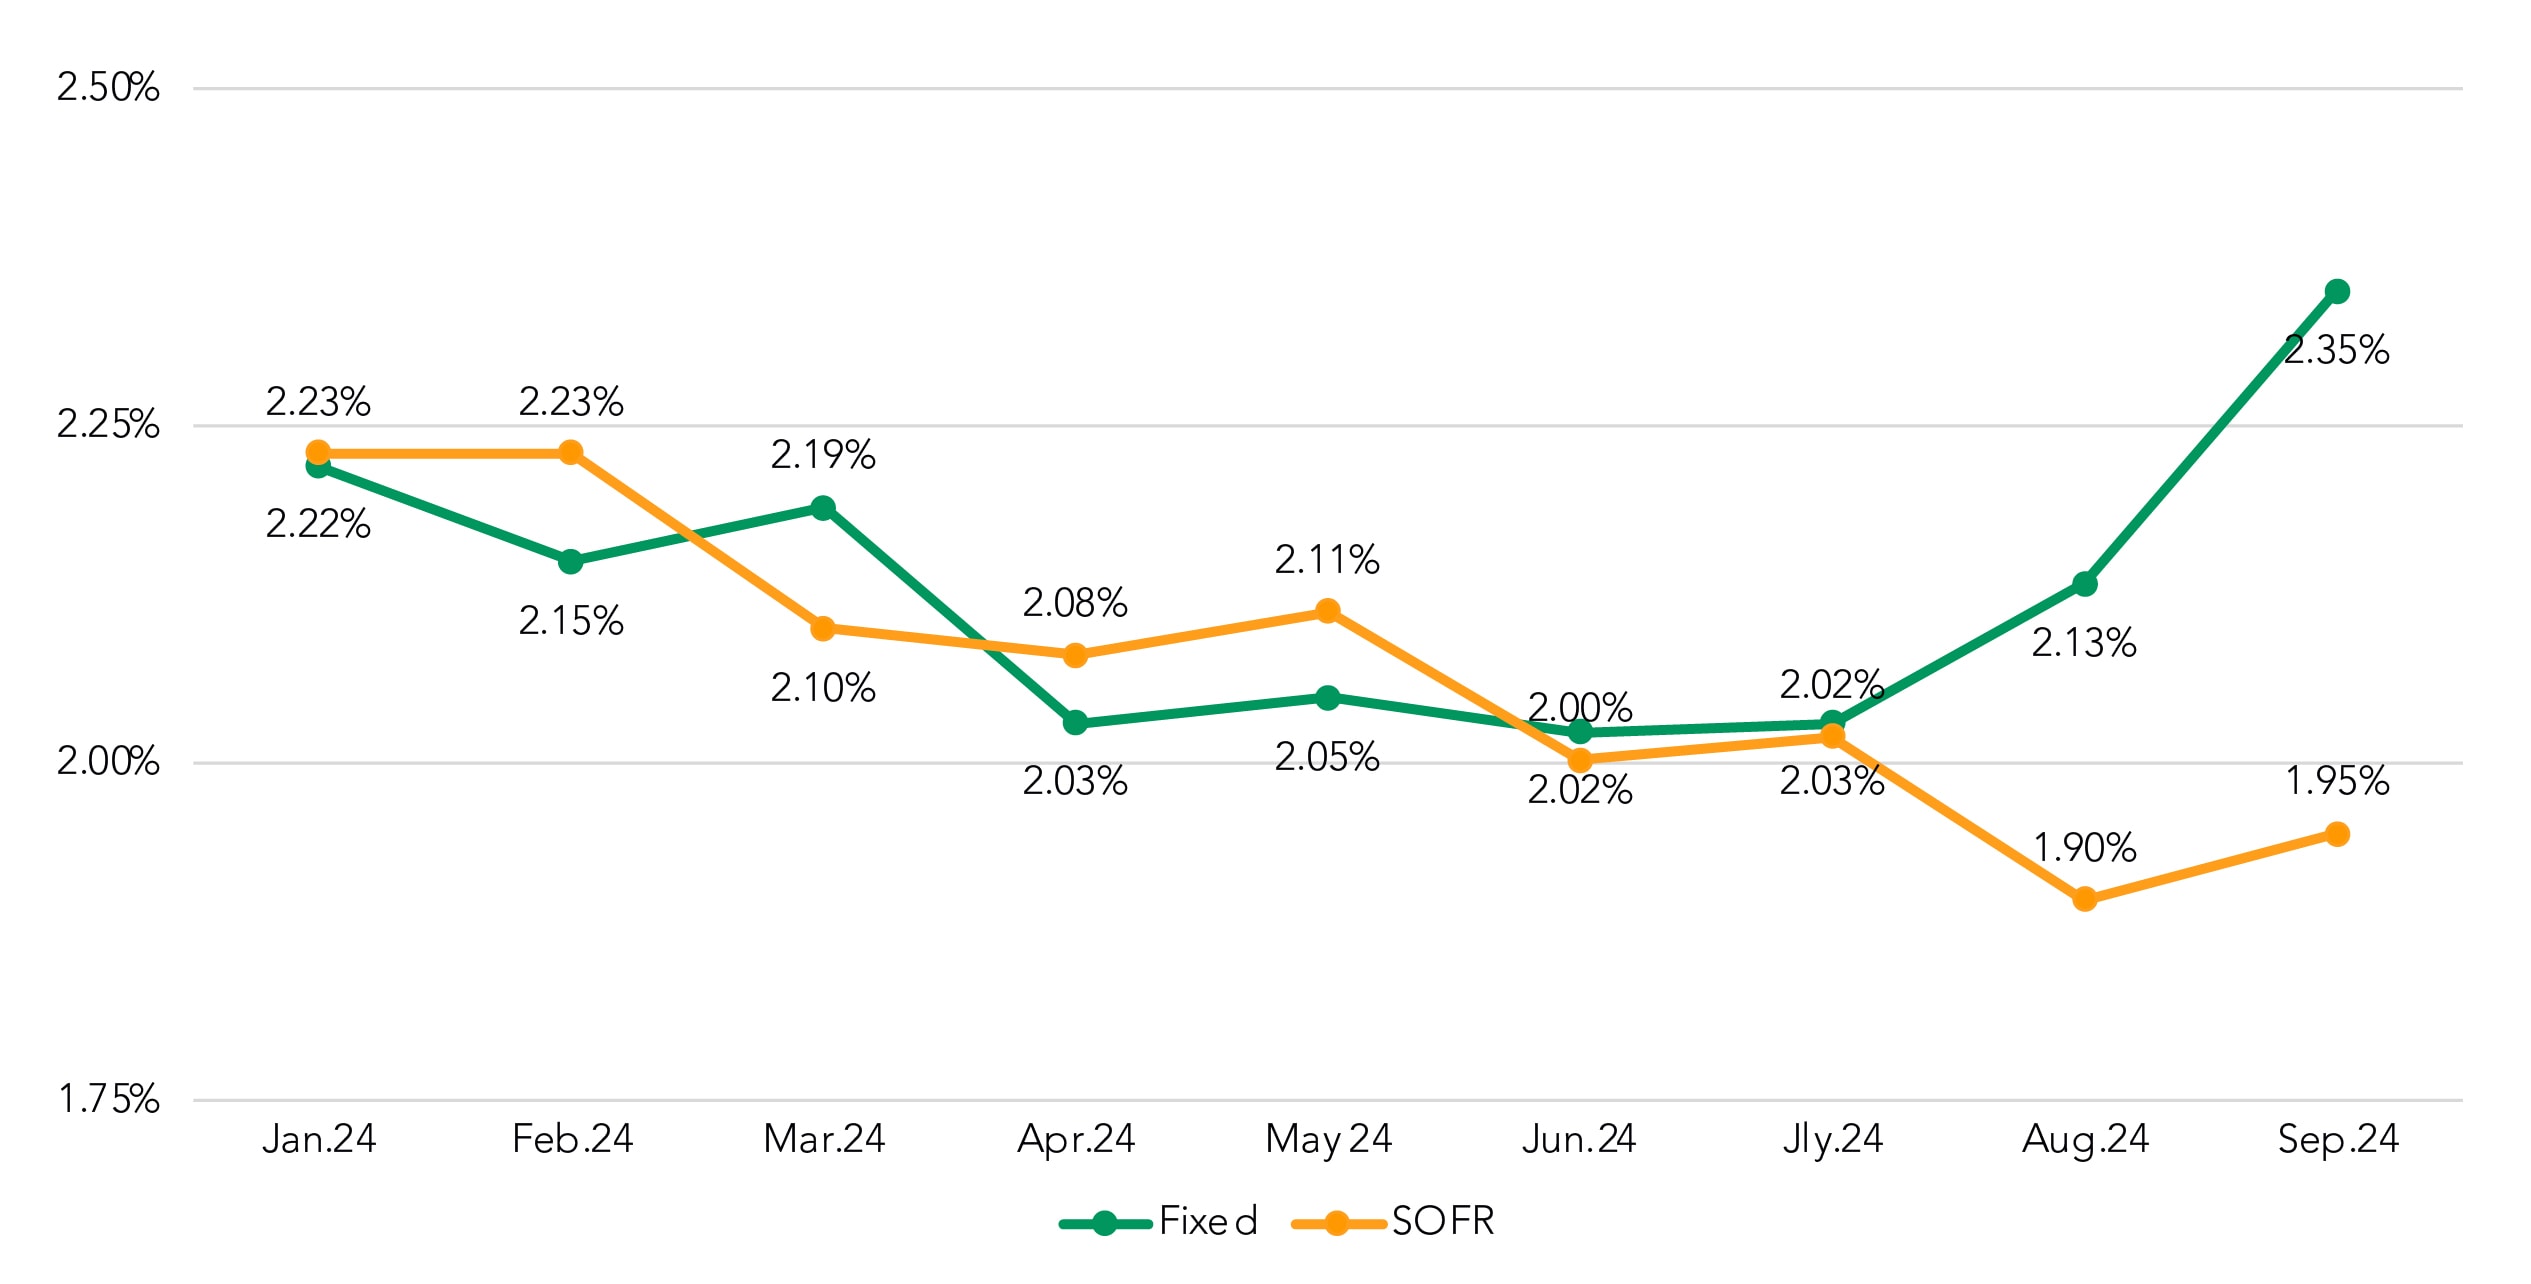
NIM diverges for fixed- and floating-rate loans
While the previous metrics all pointed to a bump up in NIM for fixed-rate loans, it’s still worth noting that, after increasing by 22 bps last month, the September mark (2.35%) was the highest mark recorded in our commercial pricing database since September 2021 (2.40%). The fixed-rate NIM average for 2024 is now up to 2.12%
Also, while SOFR NIM rebounded slightly in September — up 5 bps to 1.95% — it’s still far below its 2024 average of 2.19%. Prior to increasing this month, SOFR NIM had dropped 33 basis points from January-August.
NIM by Month
Rolling Trend
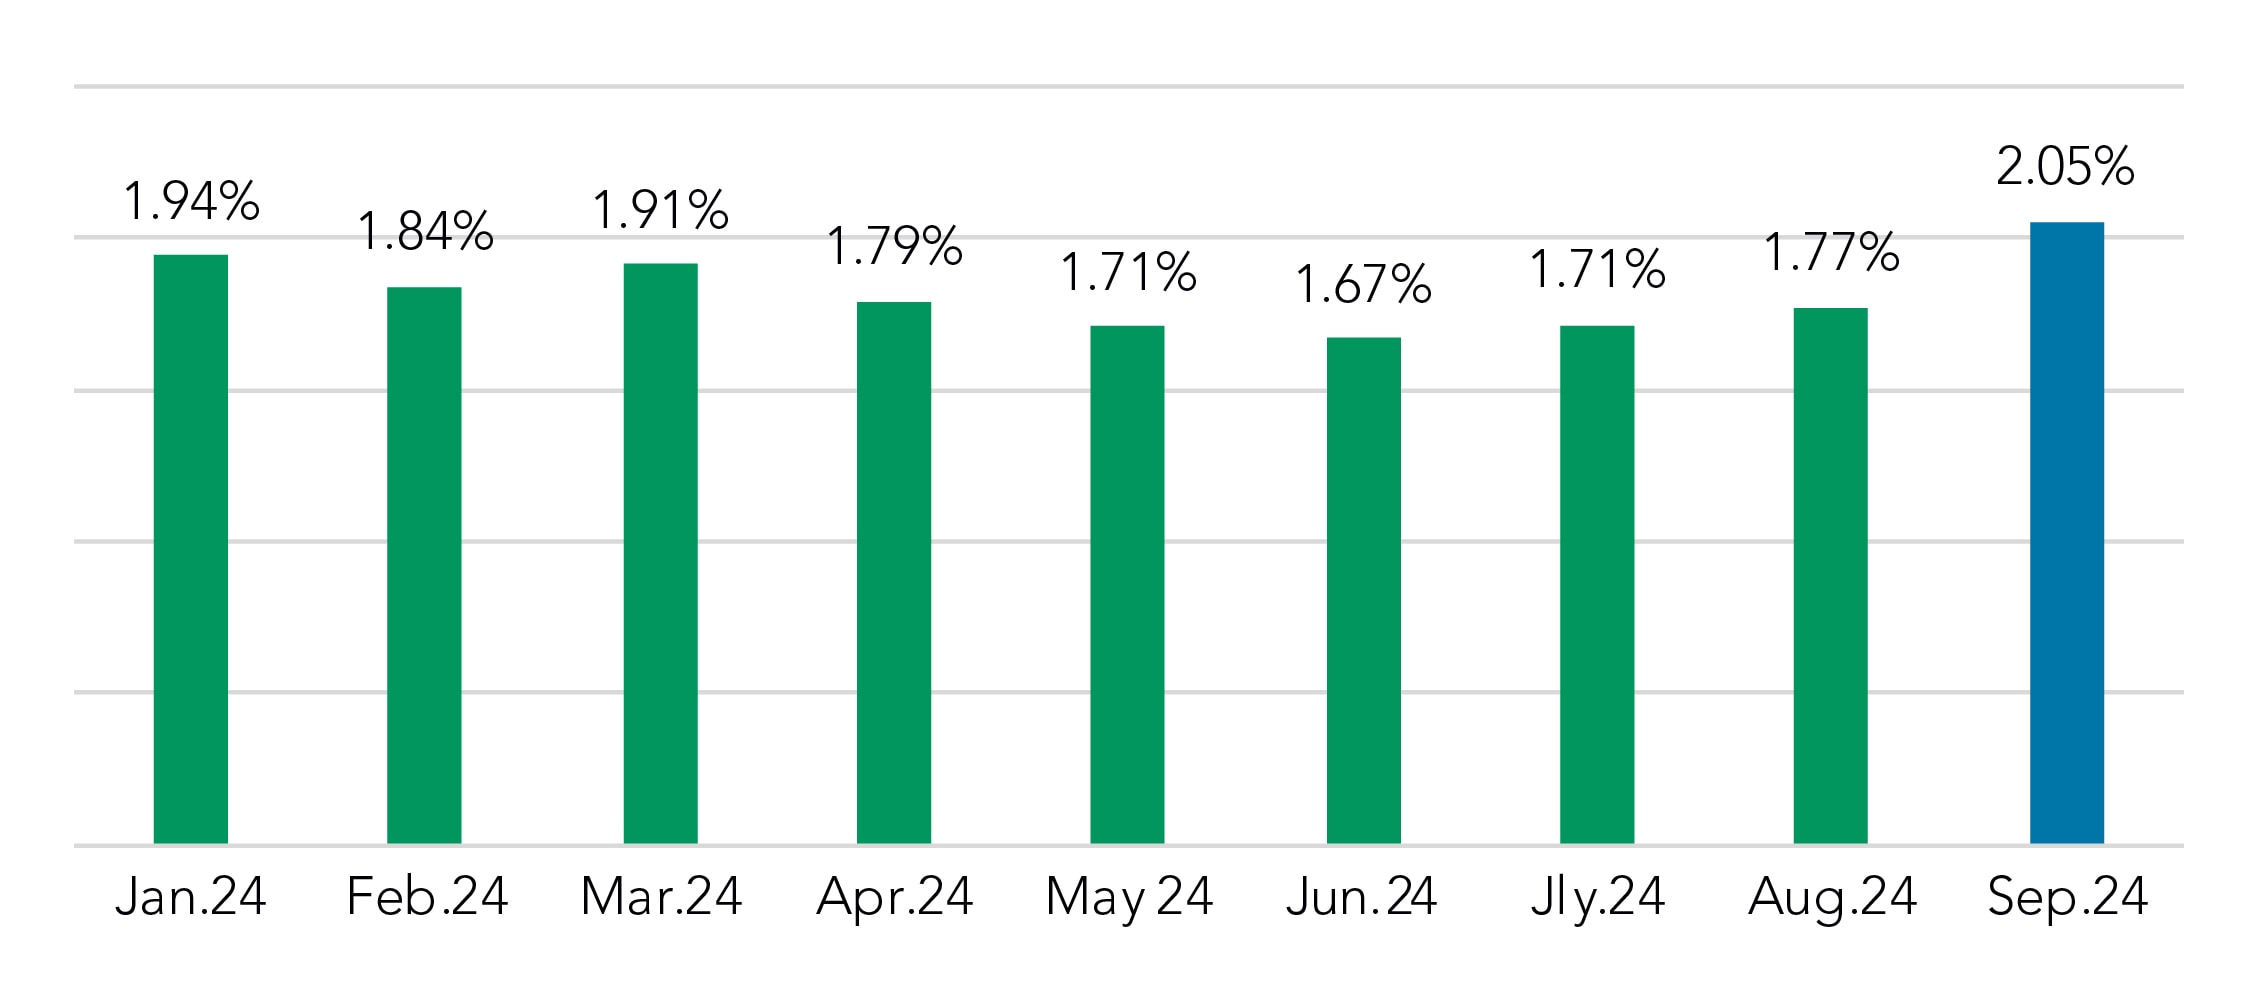
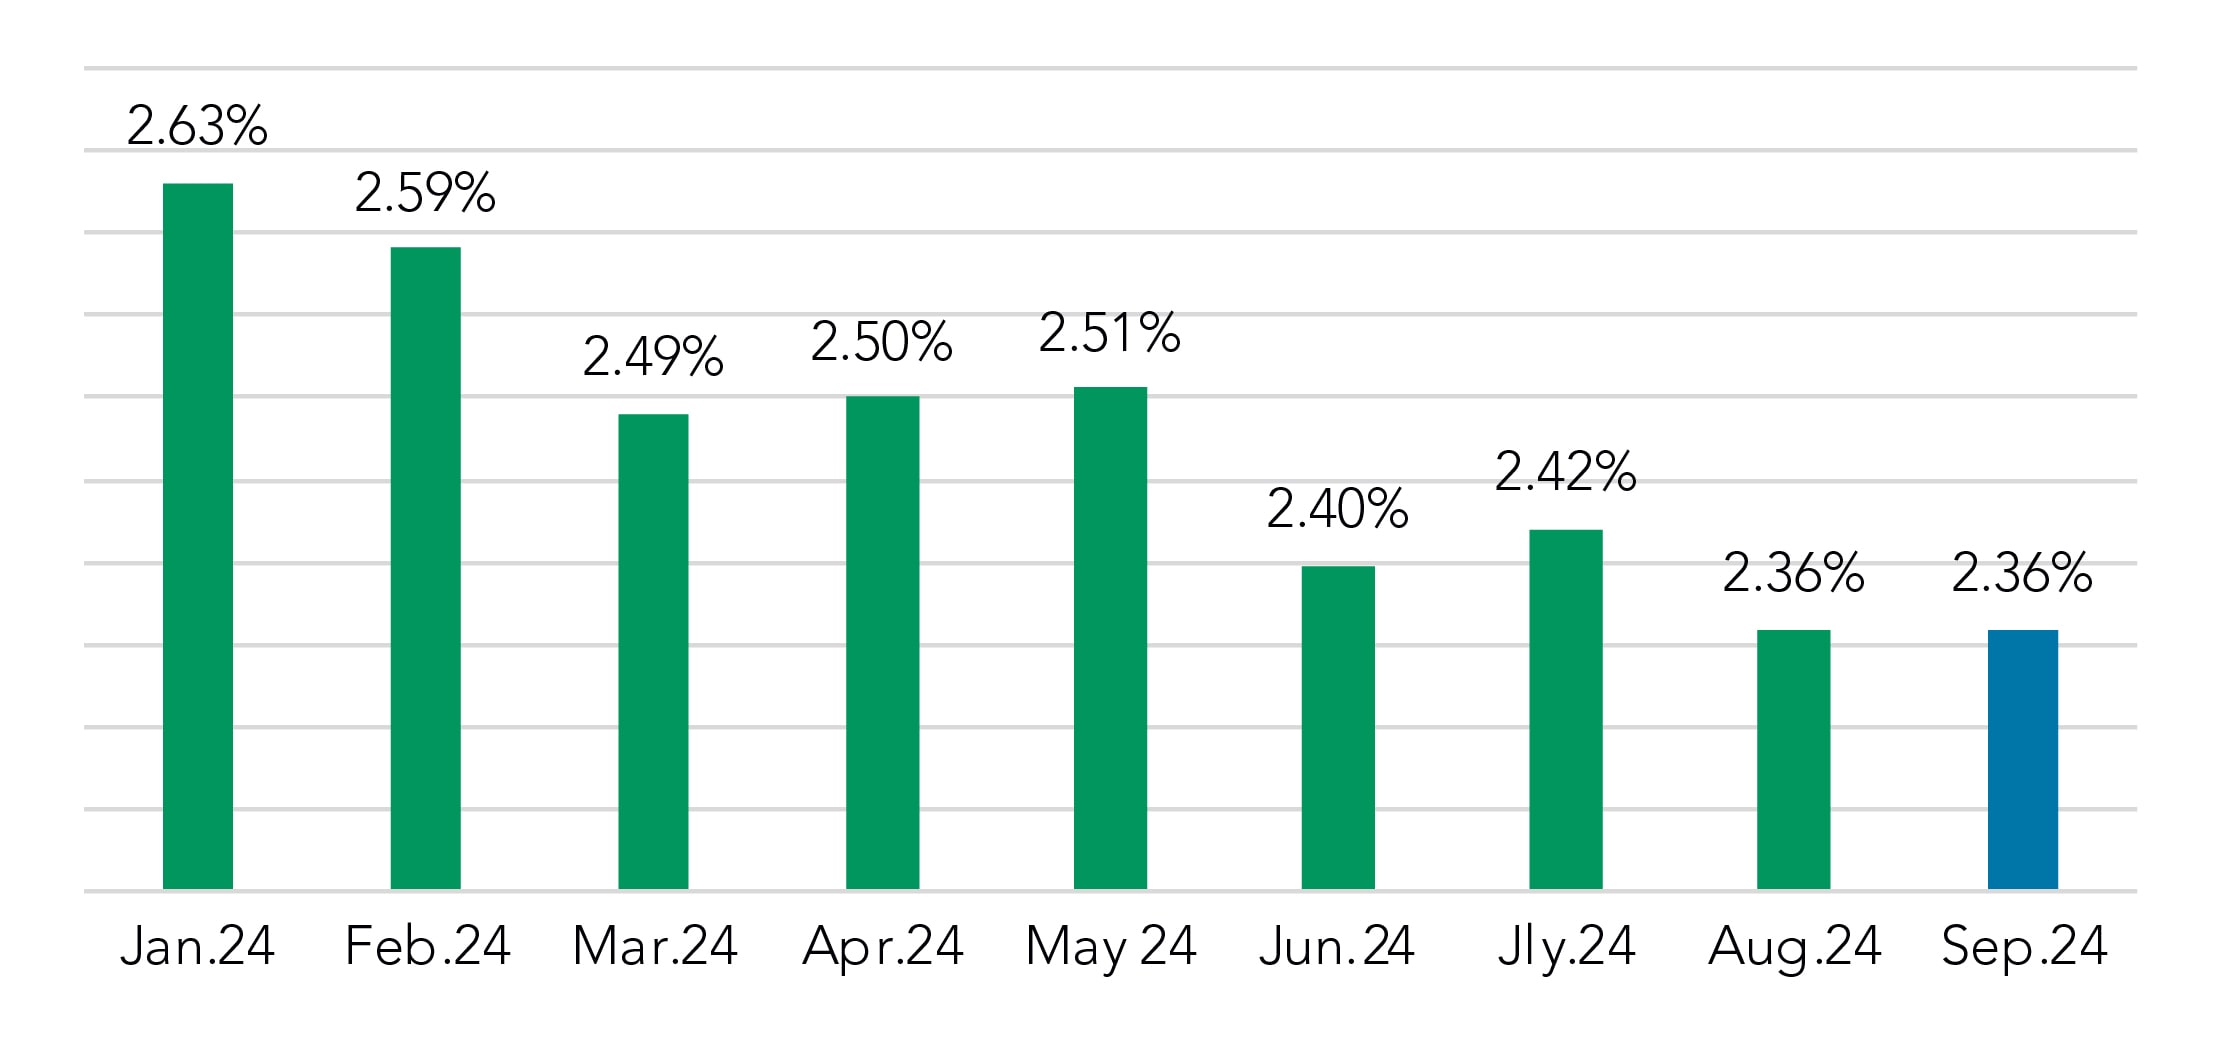
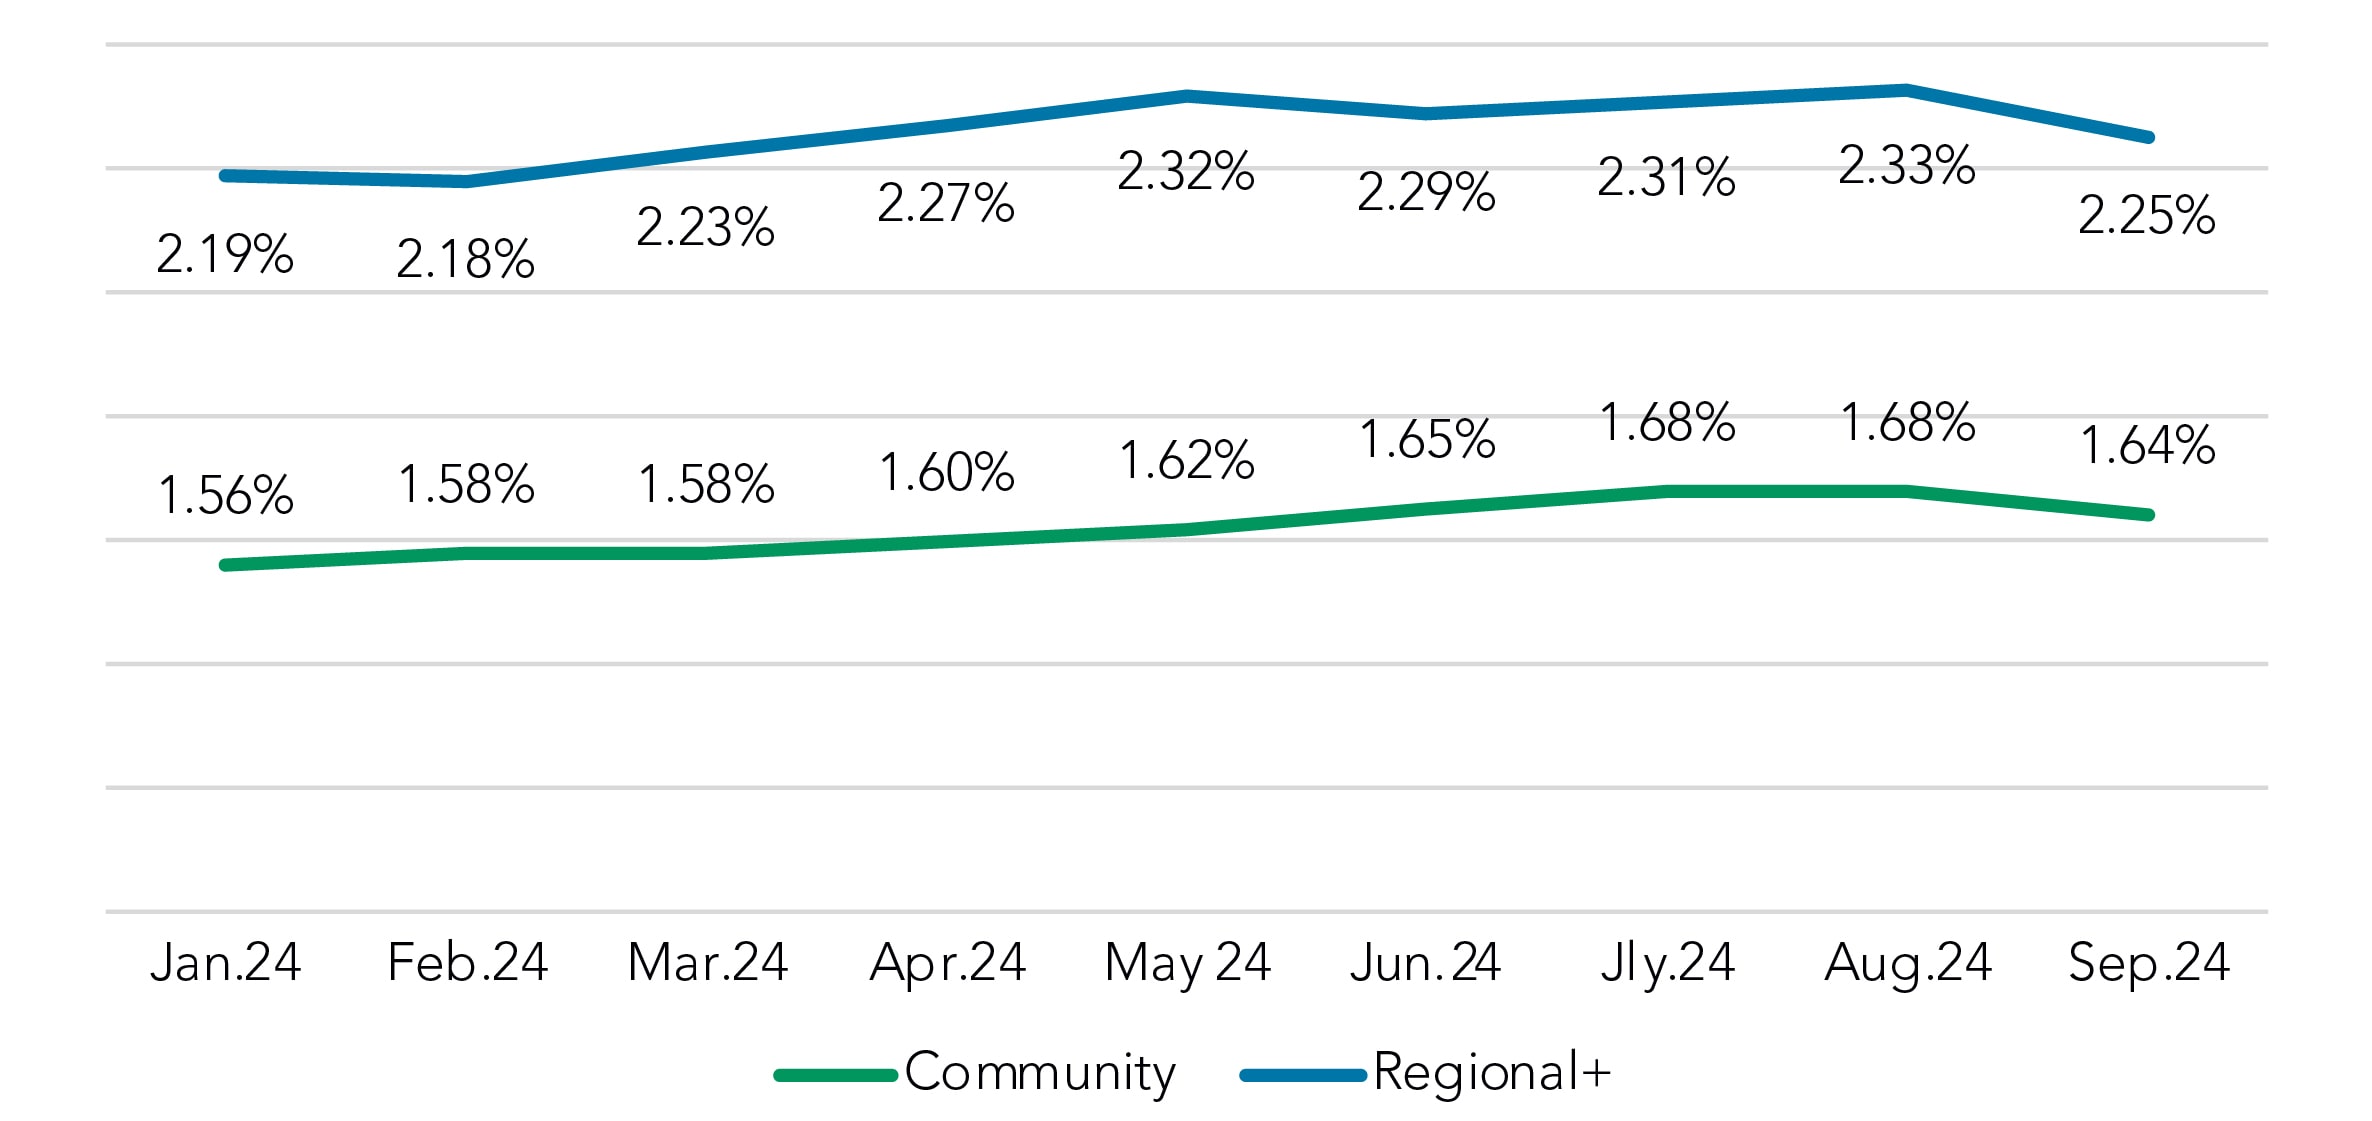
Deposit rates drop
Finally, as noted earlier, we are monitoring whether pricing managers will begin to reduce certain deposit rates now that the initial Fed rate cut has occurred.
After holding steady in August, overall deposit rates dropped in September, by 8 bps (2.33% to 2.25%) in the Regional+ segment and 4 bps (1.68% to 1.64%) in the community space. And as our note in this section indicates, these values are derived from snapshots throughout the month — before and after the mid-month fed fund rate cut.
Note: Deposit rate paid information is from portfolio snapshots sent from institutions throughout the month and is not a single month-end view.
Overall Deposit Rate Paid
Includes NIB Base
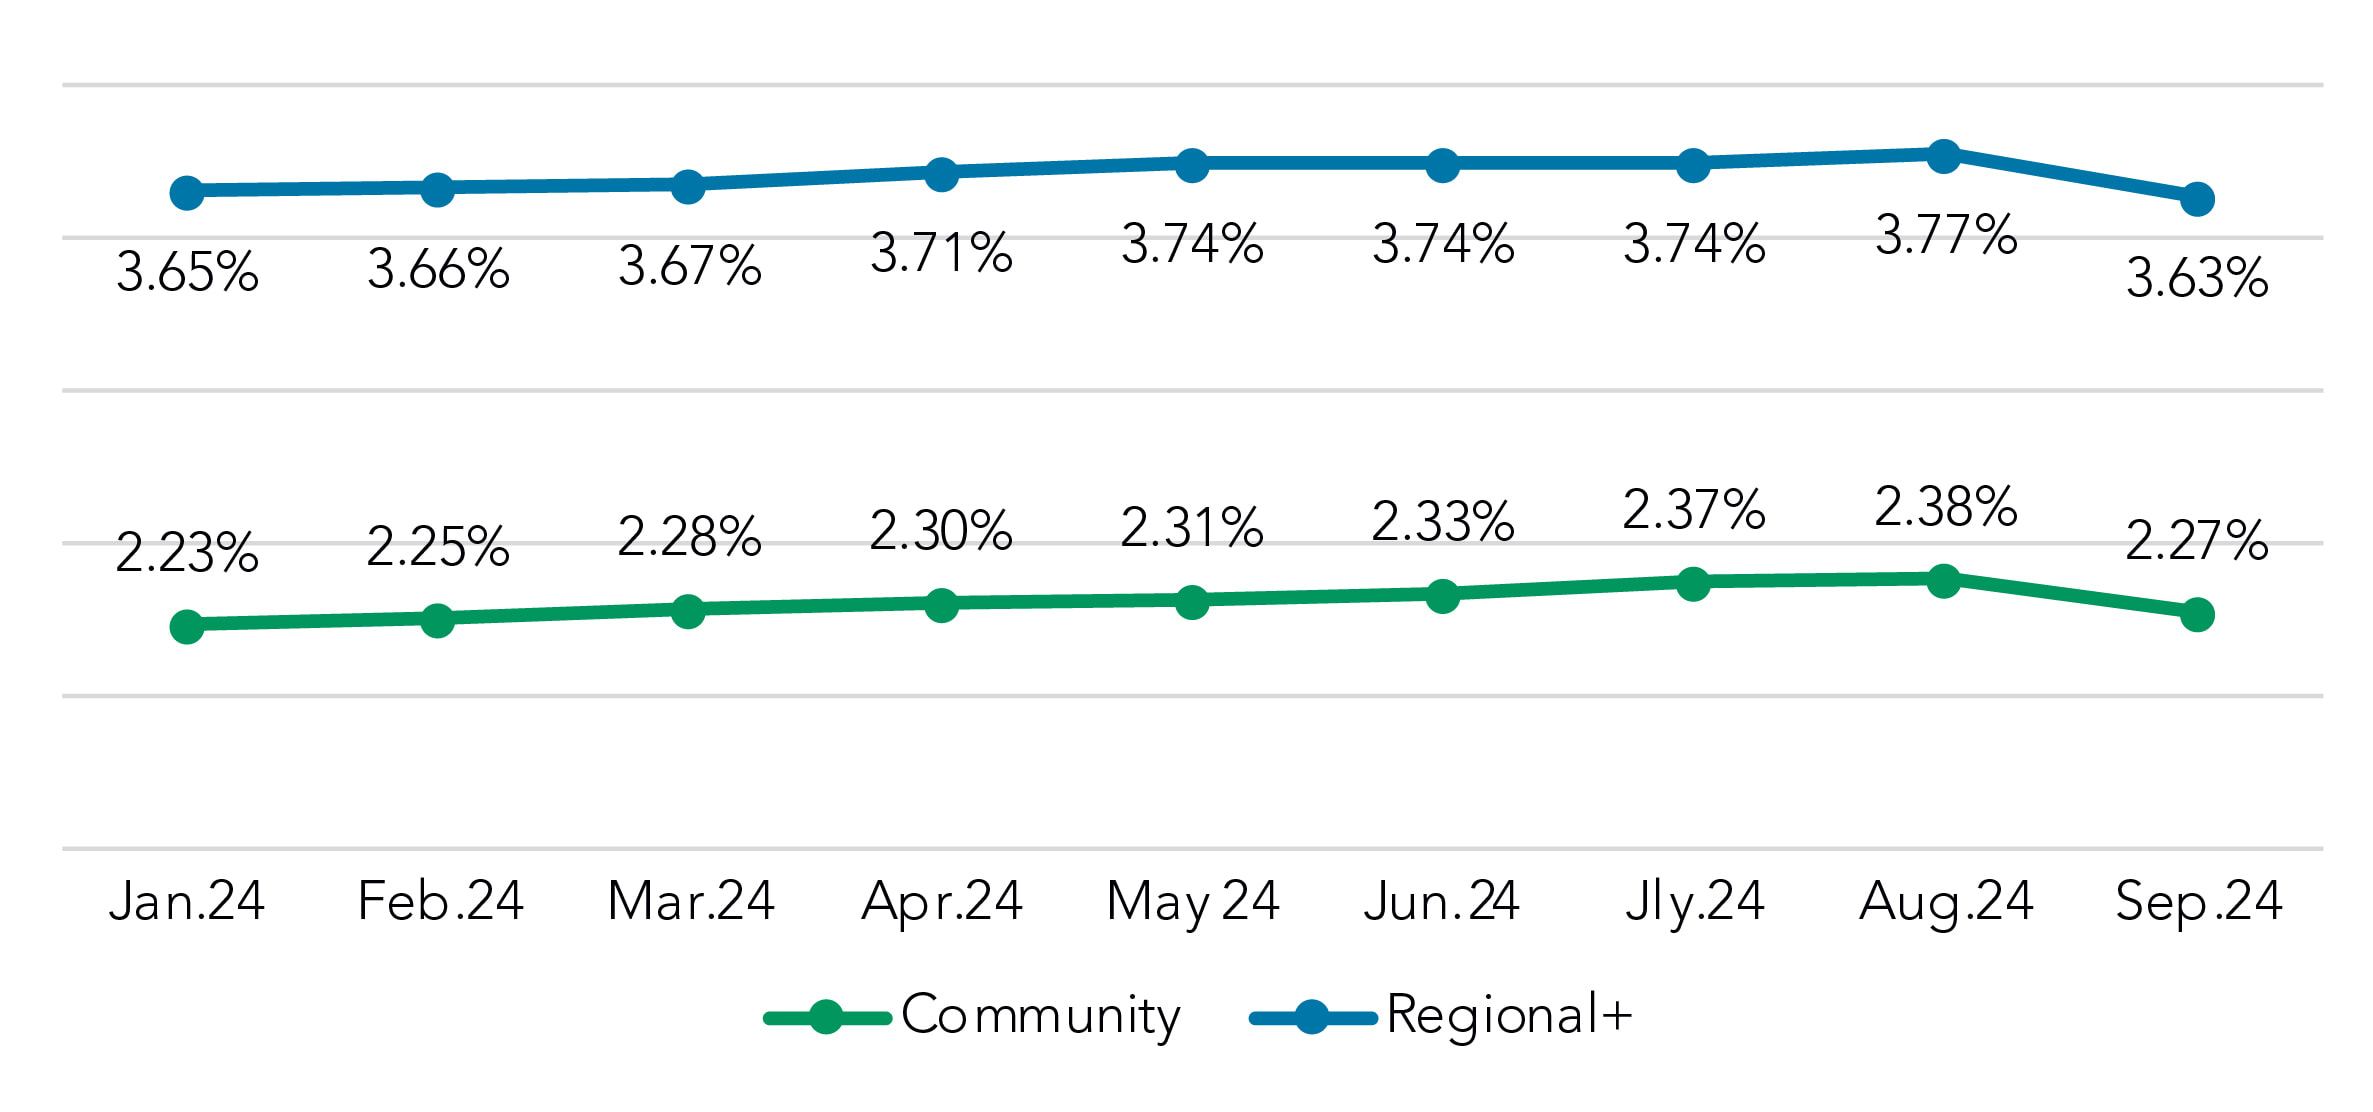
The drops were larger for interest-bearing non-time products, like money markets and savings. Here there was a 14 bps drop (4.77% to 4.63%) in the Regional+ segment and an 11 bps drop (2.38% to 2.27%) among community institutions.
Interest-Bearing Non-Time, Rate Paid
(MMDA, CWI, Savings)
Got questions?
Our banking consultants and data scientists are combing through Q2 PrecisionLender pricing data every day. If there is anything you’d like to know about what they’re seeing, please send your questions to insights@q2.com.